CONTENTS
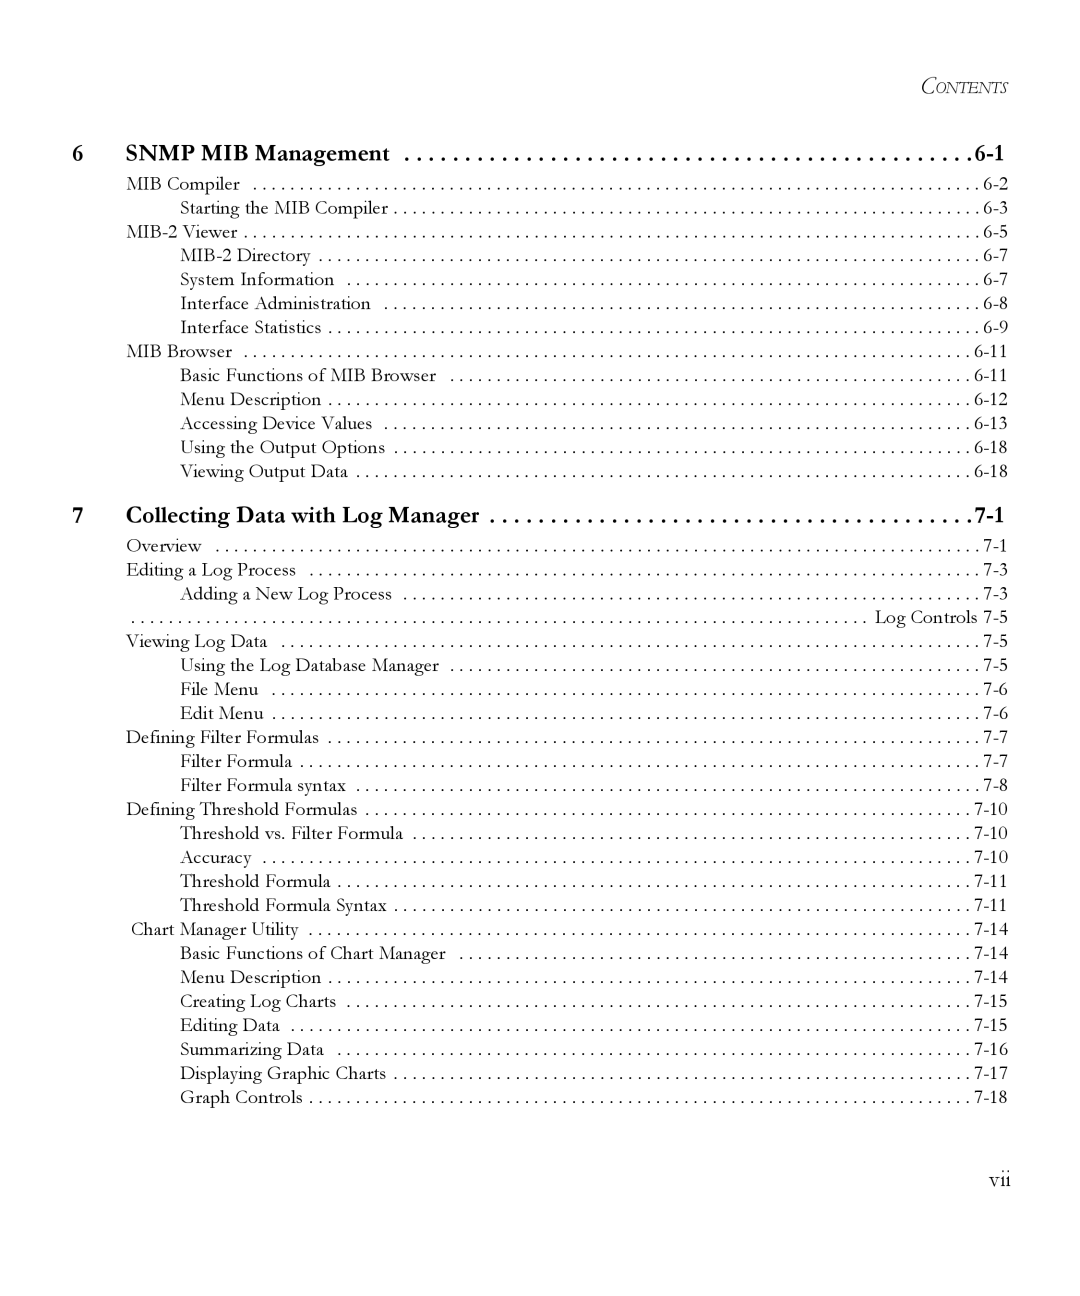
6 SNMP MIB Management . . . . . . . . . . . . . . . . . . . . . . . . . . . . . . . . . . . . . . . . . . . . . . .6-1
MIB Compiler | . |
Starting the MIB Compiler | . |
. | |
. | |
System Information | . |
Interface Administration | . |
Interface Statistics | . |
MIB Browser | |
Basic Functions of MIB Browser | |
Menu Description | |
Accessing Device Values | |
Using the Output Options | |
Viewing Output Data |
7 Collecting Data with Log Manager . . . . . . . . . . . . . . . . . . . . . . . . . . . . . . . . . . . . . . . .7-1
Overview | . . . . . . . . . . . . |
Editing a Log Process | . . . . . . . . . . . . |
Adding a New Log Process | . . . . . . . . . . . . |
. . . . . . . . . . . . . . . . . . . . . . . . . . . . . . . . . . . . . . . . . . . . . . . . . . . . . . . . . . . . . . . . . . . . . . . . . . . . . . . | Log Controls |
Viewing Log Data | . . . . . . . . . . . . |
Using the Log Database Manager | . . . . . . . . . . . . |
File Menu | . . . . . . . . . . . . |
Edit Menu | . . . . . . . . . . . . |
Defining Filter Formulas | . . . . . . . . . . . . |
Filter Formula | . . . . . . . . . . . . |
Filter Formula syntax | . . . . . . . . . . . . |
Defining Threshold Formulas | . . . . . . . . . . . |
Threshold vs. Filter Formula | . . . . . . . . . . . |
Accuracy | . . . . . . . . . . . |
Threshold Formula | . . . . . . . . . . . |
Threshold Formula Syntax | . . . . . . . . . . . |
Chart Manager Utility | . . . . . . . . . . . |
Basic Functions of Chart Manager | . . . . . . . . . . . |
Menu Description | . . . . . . . . . . . |
Creating Log Charts | . . . . . . . . . . . |
Editing Data | . . . . . . . . . . . |
Summarizing Data | . . . . . . . . . . . |
Displaying Graphic Charts | . . . . . . . . . . . |
Graph Controls | . . . . . . . . . . . |
vii
