USING RMON
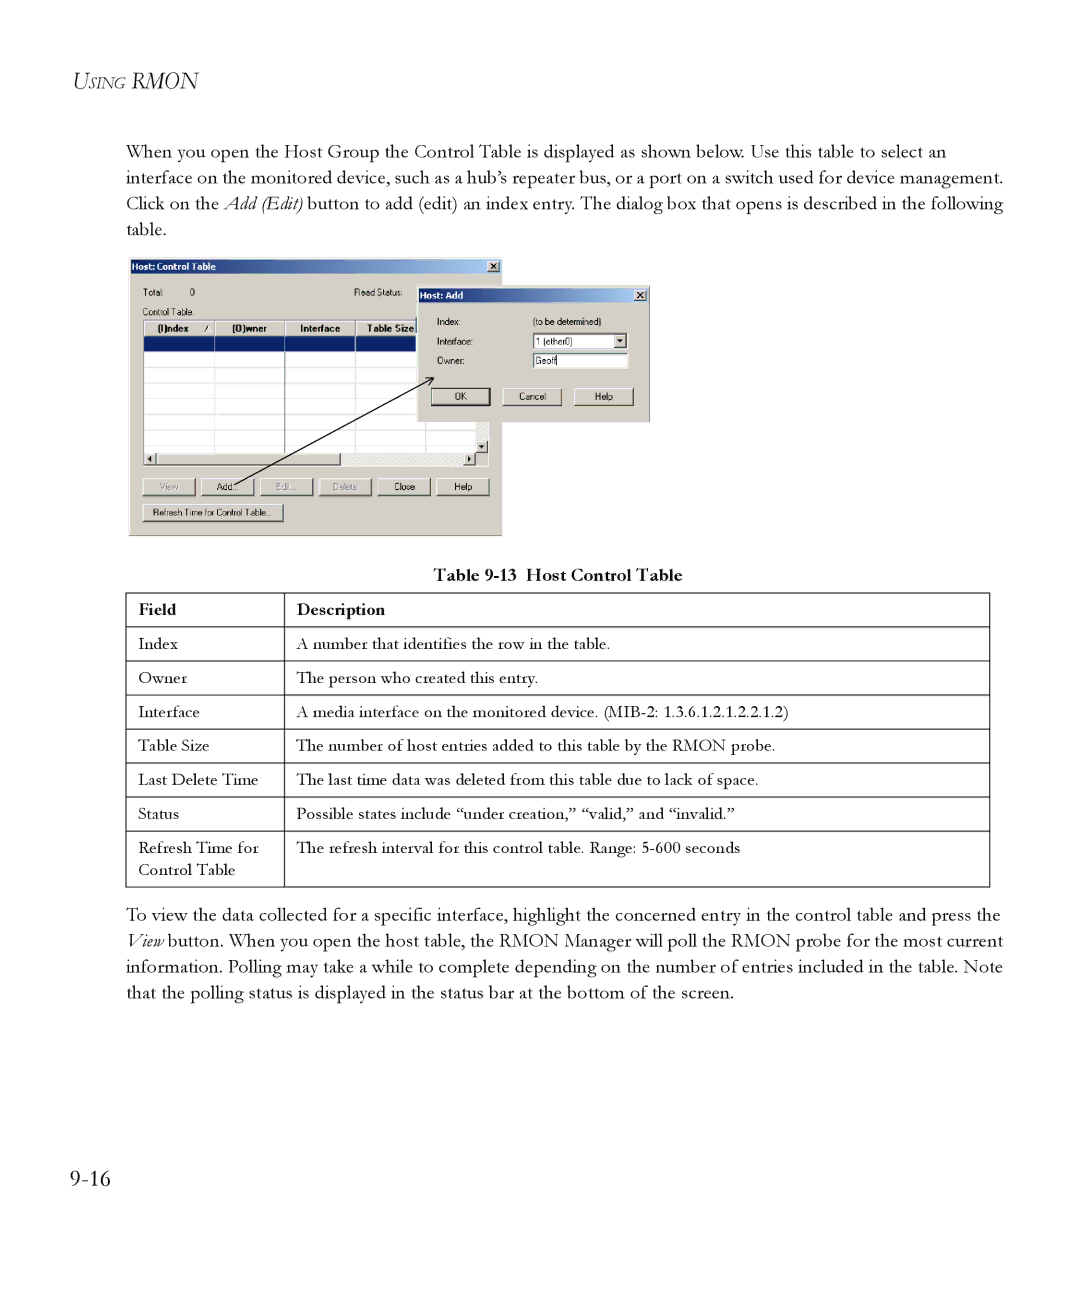
When you open the Host Group the Control Table is displayed as shown below. Use this table to select an interface on the monitored device, such as a hub’s repeater bus, or a port on a switch used for device management. Click on the Add (Edit) button to add (edit) an index entry. The dialog box that opens is described in the following table.
| Table |
|
|
Field | Description |
|
|
Index | A number that identifies the row in the table. |
|
|
Owner | The person who created this entry. |
|
|
Interface | A media interface on the monitored device. |
|
|
Table Size | The number of host entries added to this table by the RMON probe. |
|
|
Last Delete Time | The last time data was deleted from this table due to lack of space. |
|
|
Status | Possible states include “under creation,” “valid,” and “invalid.” |
|
|
Refresh Time for | The refresh interval for this control table. Range: |
Control Table |
|
|
|
To view the data collected for a specific interface, highlight the concerned entry in the control table and press the View button. When you open the host table, the RMON Manager will poll the RMON probe for the most current information. Polling may take a while to complete depending on the number of entries included in the table. Note that the polling status is displayed in the status bar at the bottom of the screen.
