COLLECTING DATA WITH LOG MANAGER
Chart Manager Utility
Raw data can only provide a rough idea of current system status. More detailed analysis is required to obtain an accurate picture of your network's overall health. The Chart Manager utility allows you to readily extract information from the database and generate a wide range of charts that provide a clear picture of network performance.
Basic Functions of Chart Manager
1.The Chart Manager window displays network statistics from a database of log information.
2.The Chart Manager can find information such as the maximum data flow of the network.
3.This information can be used for network management, resource allocation and to improve network efficiency.
Menu Description
The menus provided for the Chart Manager are briefly introduced below.
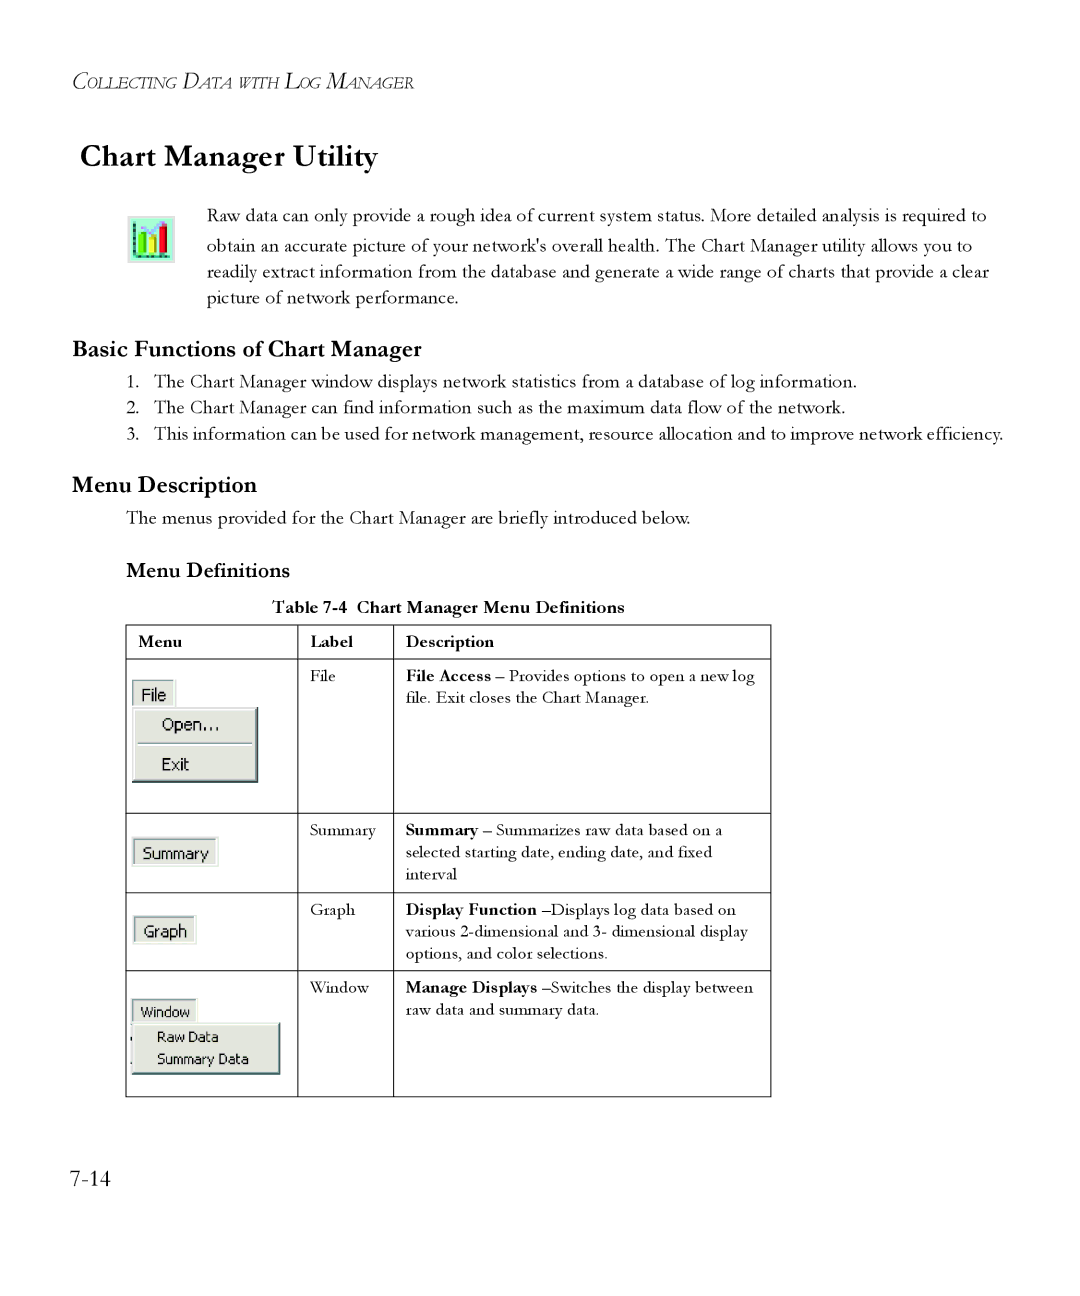
Menu Definitions
Table 7-4 Chart Manager Menu Definitions
Menu | Label | Description |
|
|
|
| File | File Access – Provides options to open a new log |
|
| file. Exit closes the Chart Manager. |
|
|
|
| Summary | Summary – Summarizes raw data based on a |
|
| selected starting date, ending date, and fixed |
|
| interval |
|
|
|
| Graph | Display Function |
|
| various |
|
| options, and color selections. |
|
|
|
| Window | Manage Displays |
|
| raw data and summary data. |
|
|
|