RMON UTILITIES
| Table |
|
|
Field | Description |
|
|
Last Delete Time | The last time data was deleted from this table due to lack of space. |
|
|
Status | Possible states include “under creation,” “valid,” and “invalid.” |
|
|
Refresh Time for | The refresh interval for this control table. Range: |
Control Table |
|
|
|
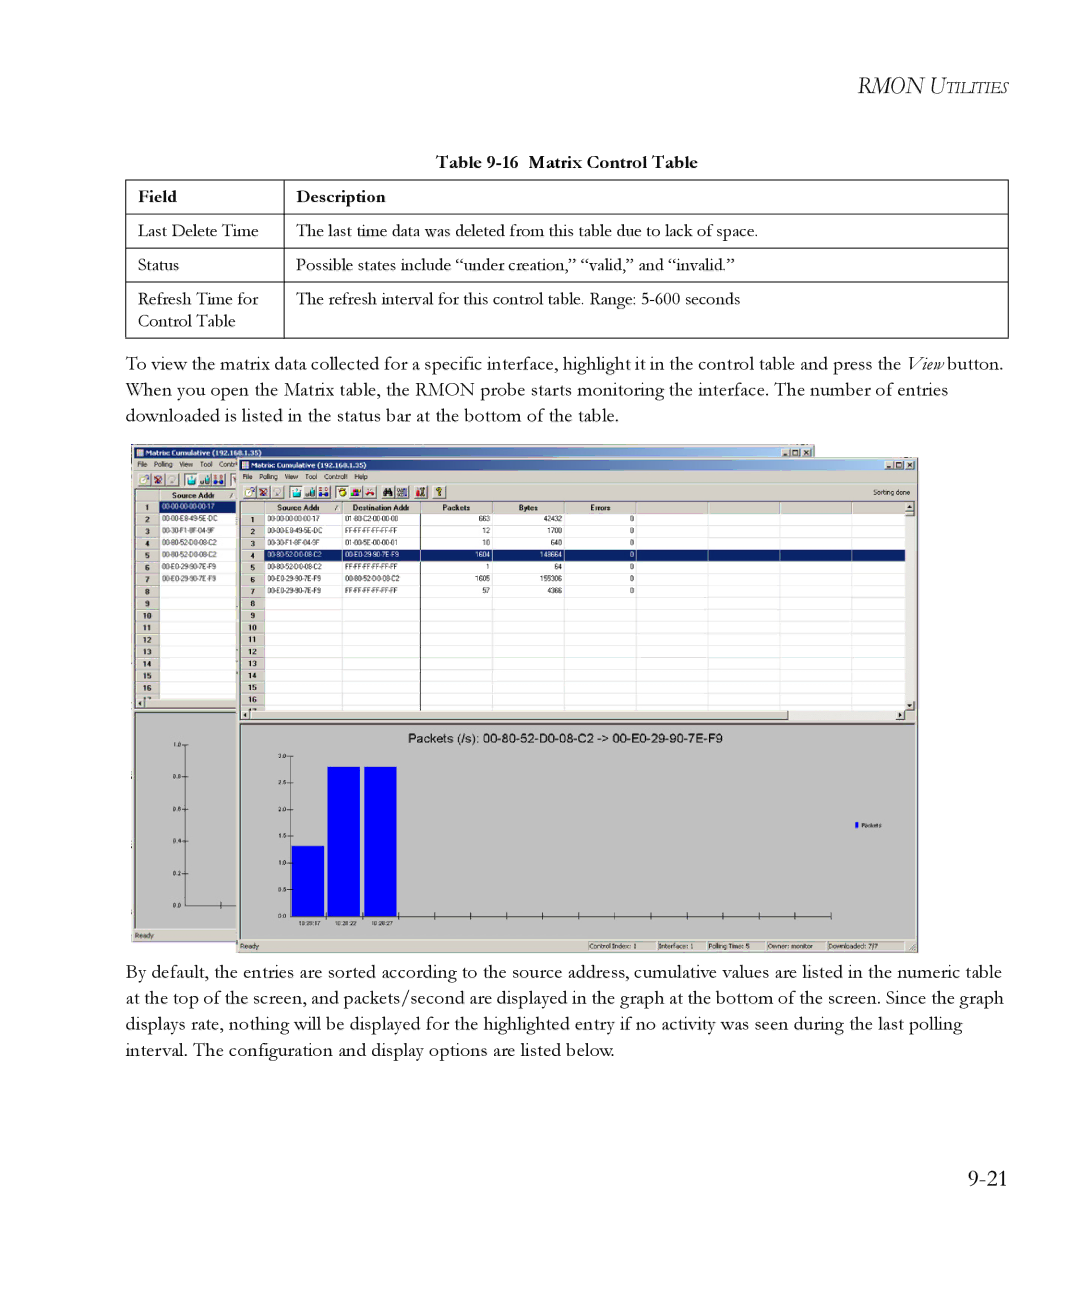
To view the matrix data collected for a specific interface, highlight it in the control table and press the View button. When you open the Matrix table, the RMON probe starts monitoring the interface. The number of entries downloaded is listed in the status bar at the bottom of the table.
By default, the entries are sorted according to the source address, cumulative values are listed in the numeric table at the top of the screen, and packets/second are displayed in the graph at the bottom of the screen. Since the graph displays rate, nothing will be displayed for the highlighted entry if no activity was seen during the last polling interval. The configuration and display options are listed below.