USING THE LOG AND EVENT MANAGERS TO MONITOR THE NETWORK
By checking the target SNMP device’s MIB, you find that the variable ezRptrTotalFrames contains the value that you need. Further, this variable belongs to the “EZ Stack 10” module. (The term MIB module is synonymous to the term “MIB Name” in the MIB variable information window of the MIB Browser.) Additional information you already know includes – index is equal to the IP address of the target SNMP device and the community is equal to public.
To monitor the total packets received by the target device:
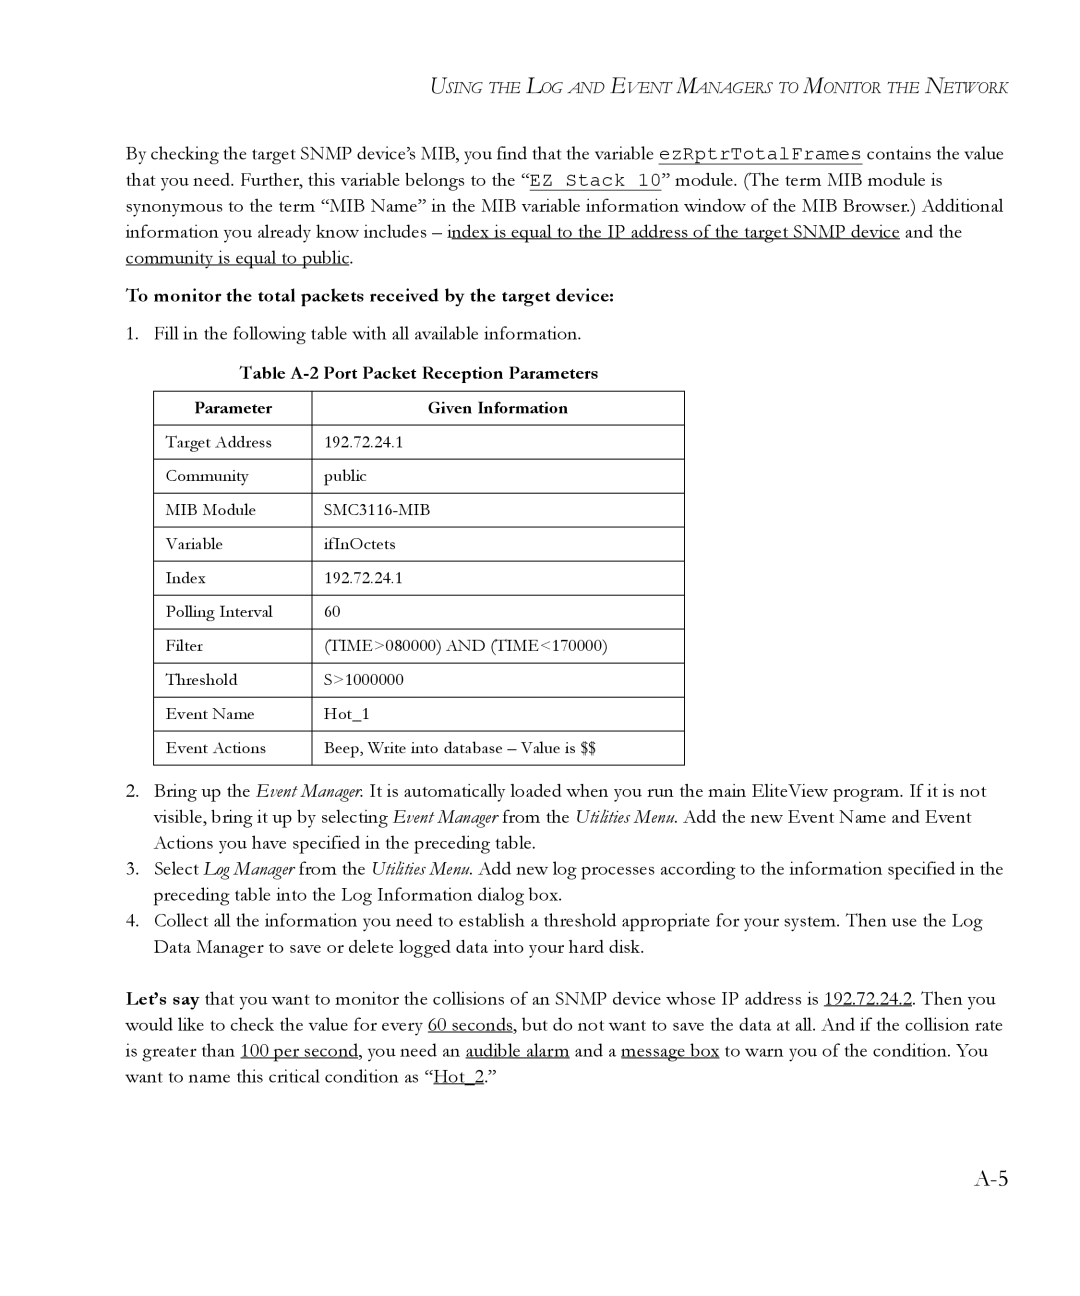
1.Fill in the following table with all available information.
Table A-2 Port Packet Reception Parameters
Parameter | Given Information |
|
|
Target Address | 192.72.24.1 |
|
|
Community | public |
|
|
MIB Module | |
|
|
Variable | ifInOctets |
|
|
Index | 192.72.24.1 |
|
|
Polling Interval | 60 |
|
|
Filter | (TIME>080000) AND (TIME<170000) |
|
|
Threshold | S>1000000 |
|
|
Event Name | Hot_1 |
|
|
Event Actions | Beep, Write into database – Value is $$ |
|
|
2.Bring up the Event Manager. It is automatically loaded when you run the main EliteView program. If it is not visible, bring it up by selecting Event Manager from the Utilities Menu. Add the new Event Name and Event Actions you have specified in the preceding table.
3.Select Log Manager from the Utilities Menu. Add new log processes according to the information specified in the preceding table into the Log Information dialog box.
4.Collect all the information you need to establish a threshold appropriate for your system. Then use the Log Data Manager to save or delete logged data into your hard disk.
Let’s say that you want to monitor the collisions of an SNMP device whose IP address is 192.72.24.2. Then you would like to check the value for every 60 seconds, but do not want to save the data at all. And if the collision rate is greater than 100 per second, you need an audible alarm and a message box to warn you of the condition. You want to name this critical condition as “Hot_2.”
