USING RMON
| Table | |
|
|
|
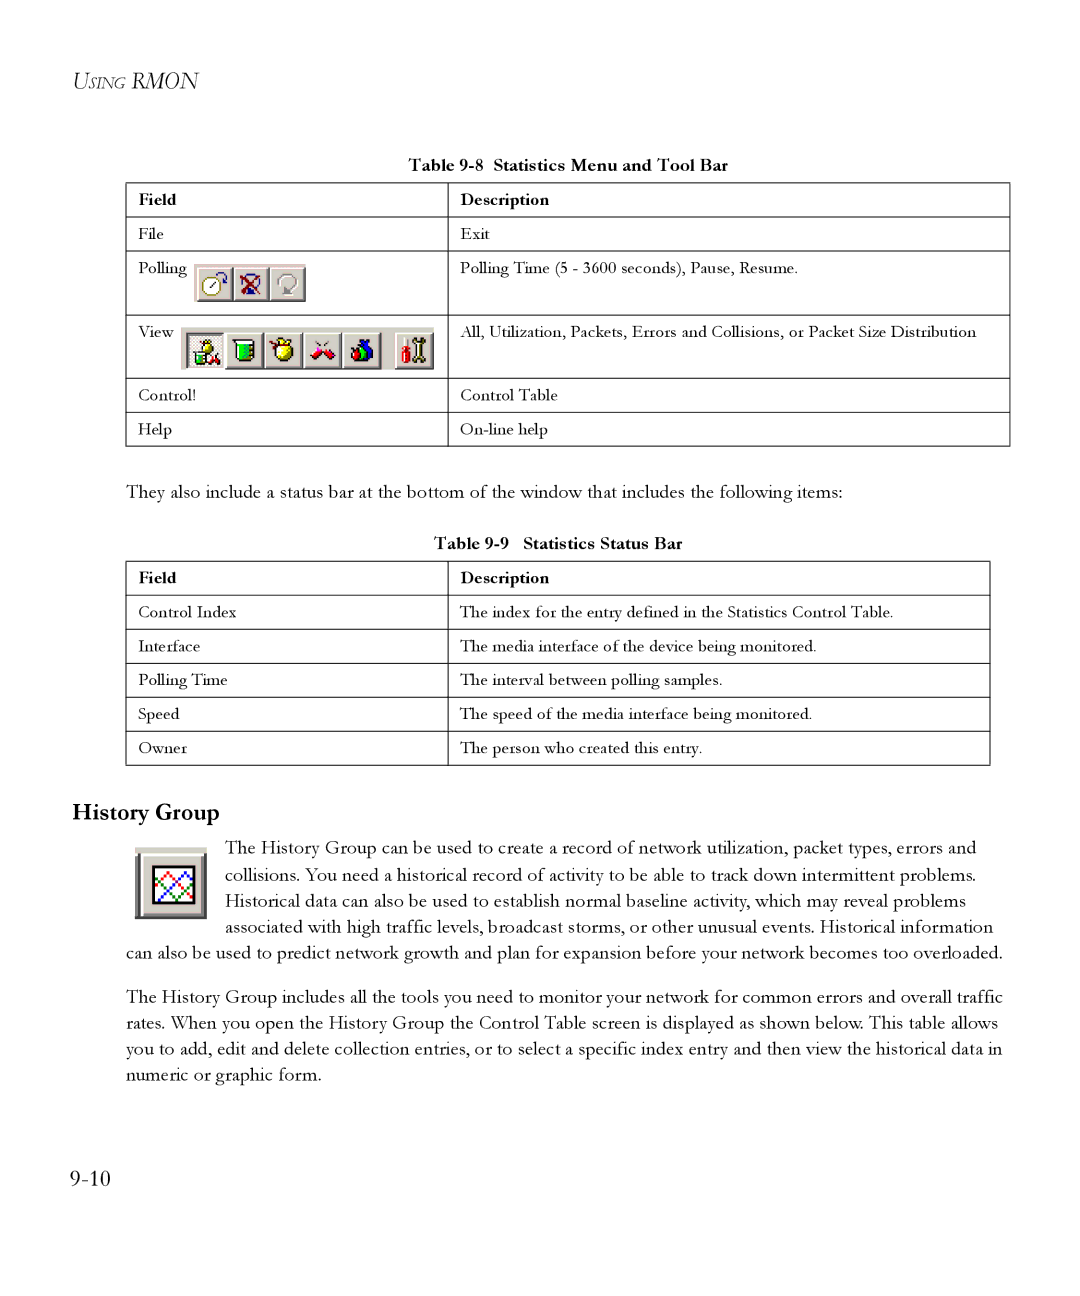
Field |
| Description |
|
|
|
File |
| Exit |
|
|
|
Polling |
| Polling Time (5 - 3600 seconds), Pause, Resume. |
|
|
|
View |
| All, Utilization, Packets, Errors and Collisions, or Packet Size Distribution |
|
|
|
Control! |
| Control Table |
|
|
|
Help |
| |
|
|
|
They also include a status bar at the bottom of the window that includes the following items:
| Table | |
|
|
|
Field |
| Description |
|
|
|
Control Index |
| The index for the entry defined in the Statistics Control Table. |
|
|
|
Interface |
| The media interface of the device being monitored. |
|
|
|
Polling Time |
| The interval between polling samples. |
|
|
|
Speed |
| The speed of the media interface being monitored. |
|
|
|
Owner |
| The person who created this entry. |
|
|
|
History Group
The History Group can be used to create a record of network utilization, packet types, errors and collisions. You need a historical record of activity to be able to track down intermittent problems. Historical data can also be used to establish normal baseline activity, which may reveal problems associated with high traffic levels, broadcast storms, or other unusual events. Historical information
can also be used to predict network growth and plan for expansion before your network becomes too overloaded.
The History Group includes all the tools you need to monitor your network for common errors and overall traffic rates. When you open the History Group the Control Table screen is displayed as shown below. This table allows you to add, edit and delete collection entries, or to select a specific index entry and then view the historical data in numeric or graphic form.