Debug Console
The Debug Console provides five tabs for monitoring system performance, testing and troubleshooting audio performance, and running system diagnostics:
•Meter View
•Gate View
•Signal Generator
•System Checks
•System Check Config
Accessing Debug Console
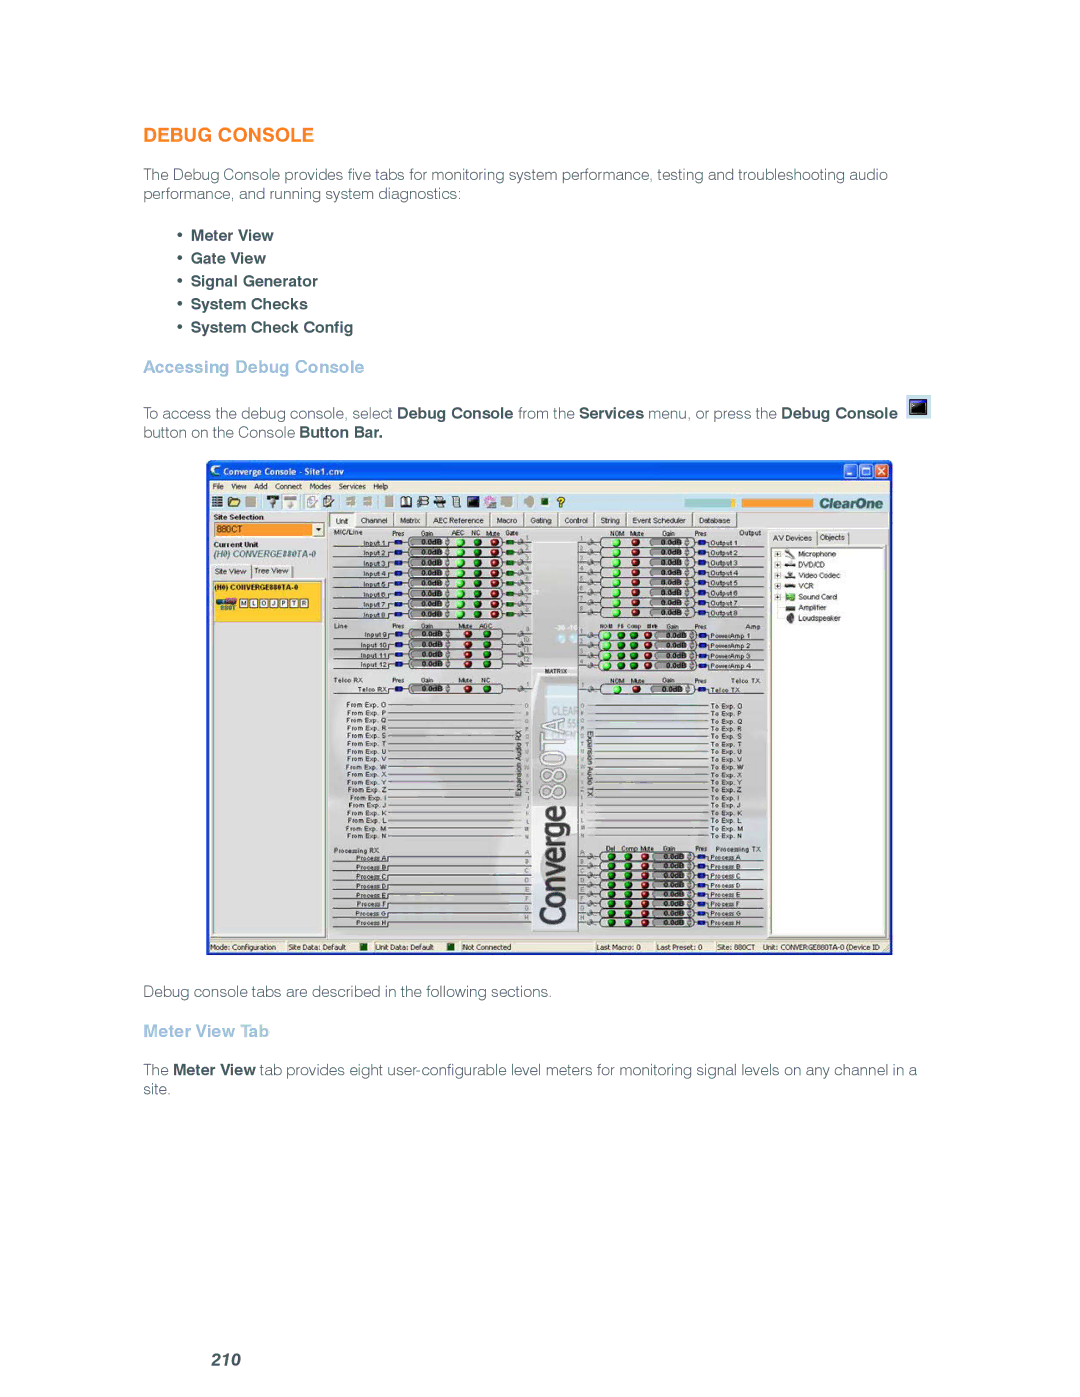
To access the debug console, select Debug Console from the Services menu, or press the Debug Console ![]() button on the Console Button Bar.
button on the Console Button Bar.
Debug console tabs are described in the following sections.
Meter View Tab
The Meter View tab provides eight
