Issue 3 03/03 US1I-6228
Video Recorder VRX180
Issue 3 03/03 US1I-6228
Copyright, Notices, and Trademarks
Copyright 2000 by Honeywell Inc
About This Document
Symbol Meanings What it means
CE conformity
Page
Contents
Online Operations Using Primary Displays
Diagnostic and Error Messages
Tables
Page
Page
Figures
126
Video Recorder Overview
Video Recorder
Specifications
Specifications
Physical
Environmental
Program Capability
Digital Inputs AC Inputs DC Inputs
Universal Analog Inputs
Analog Outputs
Digital Outputs AC Outputs DC Outputs
Relay Alarm Outputs
Logic Inputs
Time Proportional Outputs TPO on digital output
Performance/Capacities
Millivolts Volts Current Ohms
Analog Input Accuracy--Linear types
Analog input accuracy and rated limits
Analog Input --Non-linear types
RTD
Standards
Model Selection Guide
Video Recorder Model Number
TA B LE IV C O M M UN IC Atio N
Softwares and Support Parts
What’s in this section?
Topic
Unpacking
Panel mounting the video recorder
Recommendations
Installing the video recorder
Wiring the video recorder
Example
Terminal connections
Rear cover
Installation
Step a
Step B
Specification Description
Universal Analog Input Board Specifications
DI Board Terminal Block Connections
Slot ID
Digital Outputs
Do Board Terminal Block Connections
Digital Output Board
7.1 RS232 wiring configuration
Video Recorder
Recorder
Video Recorder Side PC Side
Direction Description
7.2 RS422 wiring configuration
RS422 wiring configuration
10 RS485 wiring configuration
RS485
Rear connection
Connecting the RS422/485 link to a computer
Arrangement Description
Installation
Modes of Operation
Overview
Quick Start Programming
Menu Navigation
Video Recorder Front Door Buttons
Product Info
On Line mode Main Menu
Program mode Main Menu
Maintenance mode Main Menu
Online Maint
Button functions
Button Functions
Online
On Displays
Start
Reset
Auto and Manual modes loops Force
Text Entry From External Sources
Qwerty keyboard
Qwerty Key Equivalents
Button Qwerty key Function
Ascii barcode reader
Connecting a keyboard or a barcode reader
Connector
Lift the rubber cap 1 to
Connect the mini DIN
Installing and removing a floppy disk
Definition of Function Blocks
Definition
Types of function blocks
Flow of information
Why use function blocks?
Function Block Types
Function block
Maximum Purpose Name Available
Alarm 1 Function Block Components Input parameter
Components of function blocks
Function block parameter
Output code
Block Name Code Type
Function Block Parameter Designators
Function Block Output Parameter Name
Function Function Block Output Parameter Name
How to program input parameters
How to connect an input parameter to another function block
Output Code Connection Procedure
Step Action
How to program an input parameter with a number
Function Block Connection Format
How to program a discrete input parameter with a number
Example Programming Discrete Input Parameter with a Number
How to program function block parameters
How to program a simple configuration
Programming procedure
Example Function Block Parameter Selection Procedure
Example configuration
AL 1 Alarm #1
As displayed in the Program
Menu
How to program common configurations
Programming a Current Driven Heat Treat Element
Diagram the function blocks
Label output parameters
15 Interconnections Between Function Blocks
16 Complete Function Block Diagram Of Figure
Draw the Feedback connection
18 Function Block Diagram Of Figure
Time Proportioning Relay Driven Pump
Split Output or Duplex Control
20 Function Block Diagram Of Figure
Cascade Control
22 Function Block Diagram Of The Cascade Control Strategy
Set Point Profile Implementation
23 Example Set Point Profile
Type J Thermocouple
#16
DI3 OS AO1 BC LP1 OV
Data Storage
Categories of Stored Data
Data Type File extension
Performing Data Storage
11 Data Storage File Extensions
Initializing a ZIP disk
Pre-initializing a ZIPdisk on a PC
Data Storage Status
Data storage considerations
Process and Diagnostic Data Integrity
Performing Configuration Storage
Performing Set Point Program Storage
Examples
Overview
What’s in this section?
Programming tips
Prompt Function
Program mode menu
Program Mode Menu
Prompt Range/Selections Definition
Frequently used programming prompts
Frequently Used Programming Prompts
Set Mode
Enter Labels
Overview
Entering labels with the front panel buttons
Entering labels with a Qwerty keyboard
Labels for Function Blocks
Other Labels
Unit
LPM GPH LPS GPM OHM Litr Gram GPS Degc Degf Filenames
File Cycle Dryer
Standard algorithm prompts
Program Analog Inputs
Analog Input Algorithm Selection
Temperature Unit
Custom algorithm prompts
Loop Characteristics
Characteristic What to be aware
Program Control Loops
Control Loop Programming Structure
Programming Procedure
Control Loop Type Menu Selections
CHG Action Soft PID
Loop Menu Items
10 Loop Prompts
Engineering
Feedback
Feedforward
Gain Force Remote
Manual Reset
Decimal
Position Interactive YES, no
Latching YES, no
RESET#1
Reset Limit
RATE#2
Ratio Bias
Ratio Setpoint
Setpoint Select
SETPOINT#2
Soft PID YES, no
SP DEC Slew Limit
SP LOW Limit & SP
High Limit
SP1 Tracking SP2, None
Function Block Configuration of a Typical Ratio Control Loop
Program Analog Outputs
Analog output type
11 Analog Output Types
12 Prompts For Analog Output Types
13 Analog Output Prompts
103
Program Discrete Inputs
14 Discrete Input Prompts
Input
Program Discrete Outputs
15 Discrete Output Prompts
Type Math Description Package
Program Calculated Values
16 CV Types
Peak Picking
17 Peak Picking Prompts
Signal Select
18 Signal Select Prompts
Compare
19 Compare Prompts
Compare’s Greater Than Result, With Hysteresis
20 Compare’s Condition Type and Condition Time Prompts
Then CVn OS is
Sec
Ec ext end
Pulse
RT Pulse
Preset
Counter
21 Counter Prompts
Count Down
Math
22 Math Prompts
Input a Input H
Output High Limit Operator ADD, SUBT, MULT, DIV
Free Form Math
23 Free Form Math Prompts
Input a CN5OV Input B
Input C AI1OV Input D AI2OV Sqrt ABSC/D+5
24 Free Form Math Functions
For this function or value Type this in the equation
Operator AND, OR, XOR, RESET/SET FF
Logic
25 Logic Prompts
TOGGLE/FF, ONE SHOT, Pass Input a
26 Logic Operators
For this operator Definition If this is true Then Result is
NEG
Free Form Logic
27 Free Form Logic Prompts
Example equation using operators and inputs
Example equation using iteration
29 Results of Logic Equation Using Iteration
Order of evaluation
BIT Enable
31 BCD Prompts
Example #1, loading a 2-profile program
Example #2, loading a 4-profile program
32 How Profiles Are Saved In Memory
This Profile
These
These Profiles
Function Generator
33 Function Generator Prompts
PID Function Input Generator
Function Block
RESET/RUN
Interval Timer
34 Interval Timer Prompts
Periodic Timer
10 Periodic Timer
35 Periodic Timer Prompts
36 Set Up Timer Prompts
Mass Flow
37 Mass Flow Prompts
Carbon Potential
38 Carbon Prompts
11 Typical Carbon Potential Control Configuration
Relative Humidity
39 Relative Humidity Prompts
Sterilization
40 F0 Sterilization Prompts
Heat/Cool Configuration
Advanced Splitter Output ADV Splitter
41 Advanced Splitter Prompts
Standard Splitter Output STD Splitter
42 Standard Splitter Prompts
Feedback #2
Output
High Limit Range LOW
Scaling
43 Scaling Prompts
Signal Clamp
44 Signal Clamp Prompts
OUT High Limit LOW Select
High Select
Average Period
Point Block Average 1 Pt Block Avg
45 1 Point Block Average Prompts
Rolling Average
46 Rolling Average Prompts
# of Samples
AVG Period Mins
OUT High Limit Input #1- Input #8
Multiple Input Average Multiple Avg
47 Multiple Average Prompts
Cems Rolling Average CEM Rolling Avg
Cems Block Average
48 Cems Block Average Prompts
Frame Period
49 Cems Rolling Average Prompts
Time Units
Program Alarms
50 Alarm Prompts
Program Totalizers
51 Totalizer Prompts
Program Profiles
Program Constants
52 Constant Prompts
Value
Input High Limit Destination
Destination defined
Gain #1 = Dest = LP 1 GN CV 1 OV
Copy Block
53 Copy Block Prompts
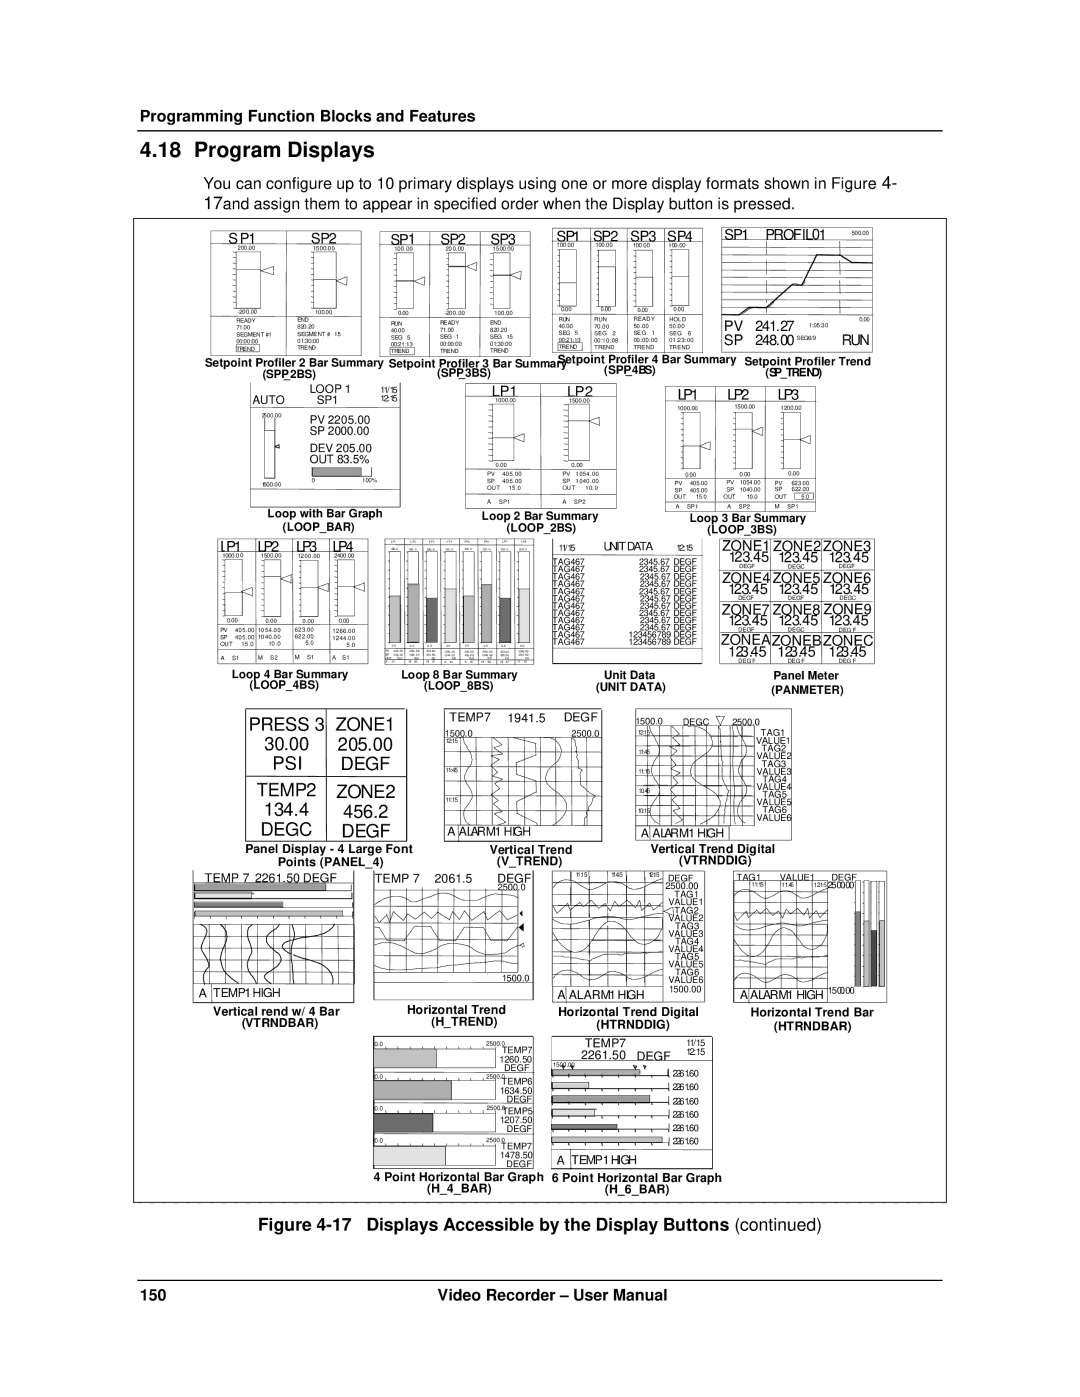
17 Displays Accessible by the Display Buttons
Program Displays
151
Display Setup Procedure
54 Display Setup Procedure
Set Up Trend
55 Set Up Trend 1 Prompts
56 Paper Chart Speed Equivalents to Time Base Selections
Set Up Trend 2 3
58 2 trend group live buffer size Trend Groups
Trend Group
59 4 trend group live buffer size Trend Groups
Set Up Bar Graph
60 Set Up Bar Graph 1 Prompts
Set Up Bar Graph 2 3
Set Up Panel Displays
Assign Displays to Keys
64 Assign Displays To Keys Prompts
Display Format
Display
Trend
Bargraph
Enable Features
65 Enable Features Prompts
Program Security
66 Security Prompts
Serial Communications
67 Serial Communications Prompts
Set Clock
68 Set Clock Prompts
Load/Store Configuration
69 Load/Store Config Files Prompts
Store Config to FILE01 CYCLE01
Disk DRYER01 PROD01
Inputs Scan Rate Control
Scan Rate
70 Suggested Scan Rates
Select Language
Setup procedure
71 Data Storage Setup Procedure
Enable storage
Data Storage
Set Up New Schedules
Trend Data
Point #12 Storage Mode
Setup
Copy Display
LOW Rate
Alarms
Trend Data 2, 3
Events
73 Stored Events
74 Unit Data Prompts
Diagnostics
Unit Data
Select Filename Cycle Dryer
Start Minute
Start Month JAN-DEC
Start DAY
Disk capacity
75 Disk capacity Prompts
76 Disk Storage Capacity of 100MB ZIP disk
Sec 10 sec 30 sec
10 min 30 min Hour
Min
Batch Control
Initializing a disk
77 Filename Extensions Of Data Storage Types
Data set Extension
Profile features
Overview of the Setpoint Profiler
Definitions
Section
Schematic of the Setpoint Profiler function block
RESET/RUN Advance
Start Hold
Shutdown Time
Single and Multi-phase Profiles
Two types of profiles
Components of a profile
Two PVs available
Number of segments
Time Units
Ramp Type = Time
Ramp Type = Rate
External Ramp Type
Ramp Type = External
Hysteresis
Guaranteed Soak
Soak segment
Event 3 State
Segment Events
Example of Segment Events
Loop to Segment =
Segment Loops
Example of invalid overlapping loops
Parameters that control a profile’s execution
Coordinating operation of multiple profilers
Discrete inputs
Parameters That Control Profiler Execution
Definition Triggered Conditions Result Present
HOT Start
Fast
Forward
Shutdown
Last
Segment
Ramp Increment
How to set up a profiler
Program Profilers menu in Program mode
Program Profiler Prompts
Setpoint Profiles Menu in Online mode
Setpoint Profiles Prompts
From Memory
Load Program
Load Program Program Number
Edit Profile Prompts
Auto Cycle OFF, on
Auto Cycle Count
Edit Profile Loops
From Segment #
Time Multiplier
Editing Segments
Edit Segments Prompts
How to load and run a profiler
14 Buttons
How to load programs from memory using Online menu
How Profiles Are Stored In Memory
Procedure To Load a Program From Memory Using Online Menu
Step Action Result/Notes
11 Disk Program Capacity
How programs are stored on a disk
10 How Profiles Are Stored On Disk
201
How to start a profiler
13 Profiler Starting Procedure
How to hold a profiler 14 Profiler Hold Procedure
How to reset a profiler 15 Profiler Reset Procedure
How to shut down a profiler 17 Profiler Shutdown Procedure
PV #2 538.67
11056
00910
3900
SP1 SP2 SP3
How to edit a profile’s segments
21 Segment Editing Procedure
208
Display Definition Function Interactive Or view only?
Displays Accessed With Display Button
Overview
Interacting With Primary Displays
Interacting with Setpoint Trend Display
Interacting with Live or Replay Trends
Prompt Definition
Find
First JAN
Last JAN
Find JAN
TEMP7
Stop Panel4 Display Rotation Procedure
Resume Panel4 Display Rotation Procedure
Interacting with Panel4 Display
Step Action Result
Interacting with Loop Displays
To perform this action Do these steps
Display Messages and Symbols
2305.5
Location
Multiple messages
Message/Symbol Color Description
Color Description shown low to high priority
Messages and Symbols Elsewhere on Display
General Error
220
Online Main Menu
Menu as displayed Function
Installing a disk
Floppy Disk Insertion/Removal Procedure
Data Storage
Typical online data storage tasks
Initializing a disk using the same storage setup
Initializing a disk using a new storage setup
How data is stored
Disk Status
Error message Definition
Initialization errors
Checking current storage setup
Prompt Comments
Starting and stopping storage
Storage Start/Stop Controls
Remaining DDD-HH-MM Trend
Data Storage Replay Procedure
Checking Data Storage Status
Examining replay data
Reading Data Storage Messages
Access Summaries
Display alarm summary
What happens during an alarm
Acknowledging alarms
Alarm Acknowledgment Procedure
Display Alarm History
What happens during a diagnostic
Acknowledging Diagnostic Messages
Diagnostic Acknowledgment Procedure
Delete All Diagnostics
Delete All Diagnostics Procedure
Product Information
Data Entry
233
Setpoint Profiles
Bold items are read-only
Tune Loop
Tune Loop Prompts
Reset #1
Reset #2
Rate #1
PROP. Band #2
Control Loop Tuning Display
Display Tuning
Pretune Loop
10 Stages Of Pretune
Pretune Stopped menu
11 Pretune Stopped Prompts
Before Starting Pretune
After Starting Pretune
Pretune Identifying & Calculating menus
12 Pretune Identifying & Calculating Prompts
Pretune Complete menu
13 Pretune Complete Prompts
Message Meaning/User action required
Pretune Abort messages
14 Pretune Abort Messages
Set Mode
Review Programming
Maintenance
What’s in this section
Routine Maintenance
Calibrate Analog Inputs
AO Module calibration
AO Module Jumper ST1 Calibrate Analog Outputs
Off-line Diagnostics
Calibrate Analog Output Procedure Step Action
Database Services
Reset Unit
Product Information
Mains Frequency
Warm Start Time
First Time Start
Demo
Diagnostic Messages
Diagnostic Error Messages
Internal error messages
Internal Error Messages
253
Loop Error Indicators
Abnormal Loop Conditions And Indicators
Error Messages
Error Messages
256
257
258
Parts
Parts Kit Description Kit Part Number
Kit Description Kit Part Number
Portable case Spare case galvanised Spare painted case
262
Security Bypass Procedure
Appendix a
264
Sikkerheskrav
DA2I-6063
Veiligheidsvereisten
DU2I-6063
Turvallisuusmääräykset
FI2I-6063
Consignes DE Securite
FR2I-6063
Sicherheitshinweise
GE2I-6063
Απαιτησεισ Ασφαλειασ
Norme DI Sicurezza
IT2I-6063
NO2I-6063
Omgivelser
Instruções DE Segurança
PO2I-6063
Normas DE Seguridad
SP2I-6063
Säkerhetsföreskrifter
SW2I-6063
Safety 276
Index
Edit Alarm Setpoints
279
Sales and Service