User Guide
Open Source Code
Copyright Information
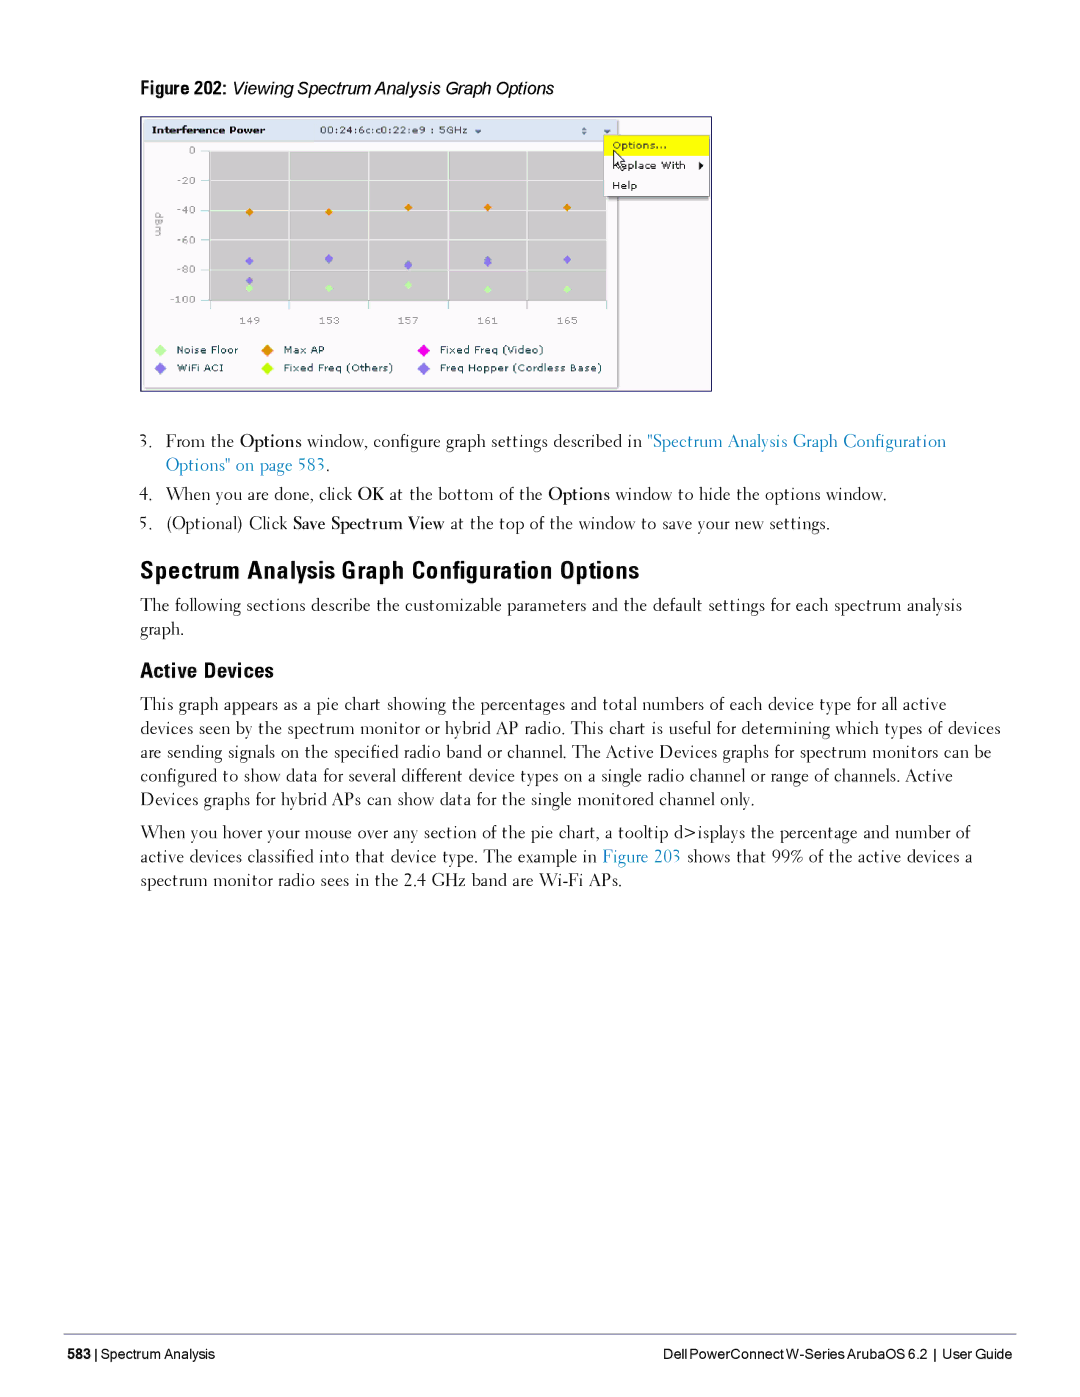
Legal Notice
Contents
Contents Dell PowerConnect W-Series ArubaOS 6.2 User Guide
Dell PowerConnect W-Series ArubaOS 6.2 User Guide Contents
Contents Dell PowerConnect W-Series ArubaOS 6.2 User Guide
Dell PowerConnect W-Series ArubaOS 6.2 User Guide Contents
Contents Dell PowerConnect W-Series ArubaOS 6.2 User Guide
Dell PowerConnect W-Series ArubaOS 6.2 User Guide Contents
Contents Dell PowerConnect W-Series ArubaOS 6.2 User Guide
Dell PowerConnect W-Series ArubaOS 6.2 User Guide Contents
Contents Dell PowerConnect W-Series ArubaOS 6.2 User Guide
Dell PowerConnect W-Series ArubaOS 6.2 User Guide Contents
Contents Dell PowerConnect W-Series ArubaOS 6.2 User Guide
Dell PowerConnect W-Series ArubaOS 6.2 User Guide Contents
Contents Dell PowerConnect W-Series ArubaOS 6.2 User Guide
Dell PowerConnect W-Series ArubaOS 6.2 User Guide Contents
Contents Dell PowerConnect W-Series ArubaOS 6.2 User Guide
Dell PowerConnect W-Series ArubaOS 6.2 User Guide Contents
Contents Dell PowerConnect W-Series ArubaOS 6.2 User Guide
Dell PowerConnect W-Series ArubaOS 6.2 User Guide Contents
Contents Dell PowerConnect W-Series ArubaOS 6.2 User Guide
Dell PowerConnect W-Series ArubaOS 6.2 User Guide Contents
Contents Dell PowerConnect W-Series ArubaOS 6.2 User Guide
Dell PowerConnect W-Series ArubaOS 6.2 User Guide Contents
Contents Dell PowerConnect W-Series ArubaOS 6.2 User Guide
Dell PowerConnect W-Series ArubaOS 6.2 User Guide Contents
Contents Dell PowerConnect W-Series ArubaOS 6.2 User Guide
Dell PowerConnect W-Series ArubaOS 6.2 User Guide Contents
Contents Dell PowerConnect W-Series ArubaOS 6.2 User Guide
Dell PowerConnect W-Series ArubaOS 6.2 User Guide Contents
Contents Dell PowerConnect W-Series ArubaOS 6.2 User Guide
Dell PowerConnect W-Series ArubaOS 6.2 User Guide Contents
485
477
490
Dell PowerConnect W-Series ArubaOS 6.2 User Guide Contents
Contents Dell PowerConnect W-Series ArubaOS 6.2 User Guide
Dell PowerConnect W-Series ArubaOS 6.2 User Guide Contents
Contents Dell PowerConnect W-Series ArubaOS 6.2 User Guide
Dell PowerConnect W-Series ArubaOS 6.2 User Guide Contents
Contents Dell PowerConnect W-Series ArubaOS 6.2 User Guide
Dell PowerConnect W-Series ArubaOS 6.2 User Guide Contents
Contents Dell PowerConnect W-Series ArubaOS 6.2 User Guide
Dell PowerConnect W-Series ArubaOS 6.2 User Guide Contents
Contents Dell PowerConnect W-Series ArubaOS 6.2 User Guide
Dell PowerConnect W-Series ArubaOS 6.2 User Guide Contents
Contents Dell PowerConnect W-Series ArubaOS 6.2 User Guide
Dell PowerConnect W-Series ArubaOS 6.2 User Guide Contents
Contents Dell PowerConnect W-Series ArubaOS 6.2 User Guide
Dell PowerConnect W-Series ArubaOS 6.2 User Guide Contents
Contents Dell PowerConnect W-Series ArubaOS 6.2 User Guide
Dell PowerConnect W-Series ArubaOS 6.2 User Guide Contents
Contents Dell PowerConnect W-Series ArubaOS 6.2 User Guide
Dell PowerConnect W-Series ArubaOS 6.2 User Guide Contents
Contents Dell PowerConnect W-Series ArubaOS 6.2 User Guide
Dell PowerConnect W-Series ArubaOS 6.2 User Guide Contents
Contents Dell PowerConnect W-Series ArubaOS 6.2 User Guide
Dell PowerConnect W-Series ArubaOS 6.2 User Guide Contents
Contents Dell PowerConnect W-Series ArubaOS 6.2 User Guide
Dell PowerConnect W-Series ArubaOS 6.2 User Guide Contents
Contents Dell PowerConnect W-Series ArubaOS 6.2 User Guide
What’s New In ArubaOS
Feature Description
About this Guide
Spectrum recording information
Users using them in a given network
Issued
Spectrum enhancements
WebUI
Fundamentals
Conventions
Related Documents
Type Style Description
Page
Basic User-Centric Networks
Understanding Basic Deployment and Configuration Tasks
Deployment Scenario #1 Controller and APs on Same Subnet
APs All on One Subnet Different from Controller Subnets
APs on Multiple Different Subnets from Controllers
Running Initial Setup
Configuring the Controller
New Port Numbering Scheme
Using the LCD Screen
Connecting to the Controller after Initial Setup
Dell W-7200 Series Controller
Displays
Uploading a Pre-saved Configuration
Using the LCD and USB Drive
Upgrading an Image
Disabling LCD Menu Functions
Configuring a Vlan to Connect to the Network
Creating, Updating, and Viewing VLANs and Associated IDs
Assigning and Configuring the Trunk Port
Creating, Updating, and Deleting Vlan Pools
WebUI
Configuring the Default Gateway
Configuring the Loopback IP Address for the Controller
To confirm the port assignments, use the show vlan command
Enter y to reboot the controller or n to cancel
Configuring the System Clock
Controller returns the following messages
Connecting the Controller to the Network
Enabling Wireless Connectivity
Configuring Your User-Centric Network
Installing Licenses
Must explicitly enable Telnet on the controller
Control Plane Security
Parameter Description
Configuring Control Plane Security
Configure the following control plane security parameters
Control Plane Security Overview
Example
CLI
Adding APs to the Campus and Remote AP Whitelists
Managing AP Whitelists
Control Plane Security Campus AP Whitelist status only
Viewing Whitelist Status
Status Entry
Address as a name
Status Entry Description
Modifying an AP in the Campus AP Whitelist
Command Description
Click the Campus AP Whitelist tab
Deleting an AP Entry from the Campus AP Whitelist
Revoking an AP via the Campus AP Whitelist
Purging the Campus AP Whitelist
Managing Whitelists on Master and Local Controllers
Campus AP whitelist contains Master switch
With local Dell
Data Column Description
Viewing and Managing the Master or Local Switch Whitelists
Viewing the Master or Local Switch Whitelist
Campus AP Whitelist Synchronization
Deleting an Entry from the Master or Local Switch Whitelist
Working in Environments with Multiple Master Controllers
Configuring Networks with a Backup Master Controller
Configuring Networks with Clusters of Master Controllers
Purging the Master or Local Switch Whitelist
Creating a Cluster Root
Click the Cluster Setting tab
To view your current cluster configuration via the WebUI
Viewing Controller Cluster Settings
Creating a Cluster Member
Replacing Controllers in a Single Master Network
Replacing a Controller on a Multi-Controller Network
Replacing a Local Controller
Replacing a Redundant Master Controller
Replacing a Master Controllerwith No Backup
Replacing a Redundant Cluster Member Controller
Replacing a Cluster Member Controller with no Backup
Replacing Controllers in a Multi-Master Network
Replacing a Local Controller in a Multi-Master Network
Replacing a Redundant Cluster Root Controller
Manually Certify Campus APs
Configuring Control Plane Security after Upgrading
Troubleshooting Control Plane Security
Identifying Certificate Problems
Disabling Control Plane Security
Verifying Certificates
Verifying Whitelist Synchronization
Rogue APs
Supported APs
Software Licenses
Understanding License Terminology
Working with Licenses
Basis What Consumes One License
Using Licenses
Working with Licenses on a Multiple Controller Network
License
Controller Total AP Count Campus APs Remote APs
Understanding License Interaction
Installing a License
License Installation Best Practices and Exceptions
Enabling a new license on your controller
Creating a Software License Key
Requesting a Software License in Email
Locating the System Serial Number
Obtaining a Software License Key
Applying the Software License Key in the WebUI
Resetting the Controller
Deleting a License
Moving Licenses
Page
Navigate to the Configuration Network VLANs
Configuring VLANs
Network Configuration Parameters
You can create and update a single Vlan or bulk VLANs
Creating Bulk VLANs In the WebUI
Navigate to Configuration Network VLANs
Creating Named VLANs
Creating a Named Vlan not in a Pool
This example assigns a Vlan name in a virtual AP
Using the WebUI
Creating a Vlan Pool
This example assigns a name to an existing Vlan ID
Creating a Vlan Pool
Distinguishing Between Even and Hash Assignment Types
Updating a Vlan Pool
Creating a Vlan Pool Using the CLI
Viewing and Adding Vlan IDs Using the CLI
Following example shows how to view Vlan IDs to a Vlan pool
Optimizing Vlan Broadcast and Multicast Traffic
Adding a Bandwidth Contract to the Vlan
Navigate to Configuration Network IP
Configuring Ports
Using the CLI
Proxy Arp is disabled for the Interface
About Trusted and Untrusted VLANs
Configuring Trusted/Untrusted Ports and VLANs
Classifying Traffic as Trusted or Untrusted
About Trusted and Untrusted Physical Ports
This example
For Port Mode select Trunk
How a Vlan Obtains an IP Address
Understanding Vlan Assignments
Assigning a Static Address to a Vlan
Enabling the Dhcp Client
Configuring a Vlan to Receive a Dynamic Address
Configuring Multiple Wired Uplink Interfaces Active-Standby
Navigate to the Configuration Network IP IP Interfaces
Select Obtain an IP address with PPPoE
Enabling the PPPoE Client
Configuring DNS/WINS Server from DHPC/PPPoE
Default Gateway from DHCP/PPPoE
Select Apply
Configuring Source NAT for Vlan Interfaces
Configuring Source NAT to Dynamic Vlan Address
Inter-VLAN Routing
Example Configuration
Using the WebUI to restrict Vlan routing
Configuring Static Routes
Navigate to the Configuration Network IP IP Interface
Modify the IP Address as required Click
Configuring the Loopback IP Address
Apply
Configuring GRE Tunnels
Configuring the Controller IP Address
Using the CLI
Static Routes
Navigate to the Configuration Network IP GRE Tunnels
Creating a Tunnel Interface
Directing Traffic into the Tunnel
WebUI
Tunnel Keepalives
CLI
IPv6 Support
This chapter describes ArubaOS support for IPv6 features
Understanding IPv6 Notation
Understanding IPv6 Topology
Enabling IPv6 Support for Controller and APs
Enabling IPv6
Features Supported on IPv6 APs?
Yes Limited
Configuring IPv6 Addresses
To Configure Link Local Address
To Configure Global Unicast Address
To Configure Loopback Interface Address
Configuring IPv6 Static Neighbors
Managing Controller IP Addresses
Configuring IPv6 Default Gateway and Static IPv6 Routes
To Configure IPv6 Default Gateway
To Configure Static IPv6 Routes
To Modify IPv6 MLD Parameters
Configuring Multicast Listener Discovery MLD
Provisioning an IPv6 AP
Debugging an IPv6 Controller
To view the EH types denied
Configuring a Captive Portal over IPv6
Filtering an IPv6 Extension Header EH
Working with IPv6 Router Advertisements RAs
Using WebUI
Configuring an IPv6 RA on a Vlan
You can use the WebUI or CLI to configure IPv6 RA on a Vlan
Using CLI
Configuring Optional Parameters for RAs
To configure RA hop-limit
Navigate to the ConfigurationNetworkIP
To configure neighbor discovery retransmit time
To configure IPv6 recursive DNS server
Viewing IPv6 RA Status
Supported Network Configuration
Authentication Method Supported for IPv6 Clients?
Understanding Authentication
XSec No not tested MAC-based Yes
Authentication Description Method
Working with Firewall Features
Understanding Firewall Policies
Field Description
For Host IP, enter 2002d81ff9f01000
To assign an IPv6 policy using the WebUI
Creating an IPv6 Firewall Policy
Assigning an IPv6 Policy to a User Role
Understanding IPv6 Exceptions and Best Practices
Managing IPv6 User Addresses
Host config #ipv6 enable
Link Aggregation Control Protocol Lacp
Understanding Lacp Best Practices and Exceptions
Set the port priority
Configuring Lacp
Lacp Sample Configuration
151
OSPFv2
Understanding Ospf Deployment Best Practices and Exceptions
Below is the routing table for Router
Understanding OSPFv2 by Example using a Wlan Scenario
Wlan Topology
Wlan Routing Table
Branch Office Ospf Topology
Branch Office Topology
Routing table for Router 1 is below
Configuring Ospf
Branch Office Routing Table
Routing table of the Central office controller is below
Select the Add button to add an area see Figure
General Ospf Configuration
Remote Branch
Sample Topology and Configuration
Remote Branch
Central Office Controller-Active
Central Office Controller-Backup
OSPFv2 Dell PowerConnect W-Series ArubaOS 6.2 User Guide
Dell PowerConnect W-Series ArubaOS 6.2 User Guide OSPFv2
Tunneled Nodes
Understanding Tunneled Node Configuration
WebUI
Configuring a Wired Tunneled Node Client
Navigate to ConfigurationAdvanced ServicesWired Access
For example
Verify the configuration
Configuring an Access Port as a Tunneled Node Port
Configuring a Trunk Port as a Tunneled Node Port
Locate the Wired Access Concentration Configuration section
On the tunneled node client
Sample Output
Page
Understanding Servers and Server Groups
Authentication Servers
Configuring a Radius Server
Configuring Servers
Describes the parameters you configure for a Radius server
NAS IP address to send in Radius packets
Timeout
Default 5 seconds
Override the global configuration
Set a DNS Query Interval
Configuring an RFC-3576 Radius Server
Radius Server Authentication Codes
Radius Server Fully Qualified Domain Names
Describes the parameters you configure for an Ldap server
Configuring an Ldap Server
Host IP address of the Ldap server Default N/A Admin-DN
Type Connection type is Ldap-s Start-tls Clear-text
Configuring a TACACS+ Server
Enter parameters as described in Table
Defines the TACACS+ server parameters
Configuring a Windows Server
Managing the Internal Database
Configuring the Internal Database
Parameters
Parameters Description
Enter the following command in enable mode
Managing Internal Database Files
Exporting Files in the WebUI
Working with Internal Database Utilities
Configuring Server Groups
Configuring Server List Order and Fail-Through
Configuring Server Groups
Select Fail Through
Configuring Dynamic Server Selection
Scroll to the right and click Add Server Click Apply
Click Add Rule
Trimming Domain Information from Requests
Configuring Match Fqdn Option
Configuring Server-Derivation Rules
Default bottom
Controller when the rule is applied
Top
Assigning Server Groups
User Authentication
Management Authentication
Navigate to the Configuration Management Administration
Radius Accounting
Accounting
Select AAA Profile, then select the AAA profile instance
Timer Description
Configuring Authentication Timers
TACACS+ Accounting
Range
Setting an Authentication Timer
Default 5 minutes
Logon User Lifetime
Parameter
Configuring MAC-Based Authentication
MAC-based Authentication
Configuring the MAC Authentication Profile
Disables blacklisting
Configuring Clients
Using the WebUI to configure a MAC authentication profile
Using the CLI to configure a MAC authentication profile
CLI
802.1X Authentication
Understanding 802.1X Authentication
Supported EAP Types
Configuring Authentication with a Radius Server
802.1X Authentication with Radius Server
Configuring Authentication Terminated on Controller
Configuring 802.1X Authentication
This option is disabled by default
Failures, and the default value is 0 failures
Default User Role Guest role Reauthentication
Timer per role overrides this setting
Requests
Interval Seconds, and the default value is 30 seconds
Default value is
Count
Option is disabled by default
Key Exchange Delay between WPA/WPA2
Disable this feature
Authentication takes place
Negotiation Disabled by default WPA-Fast-Handover
For the cached information. The default value is 24 hours
Use to authenticate itself to the client
Disabled by default
Configuring and Using Certificates with AAA FastConnect
Machine User Auth Description Role Assigned Status
Configuring User and Machine Authentication
Virtual AP profile
Authenticated Vlan configured Virtual AP profile
Enabling 802.1x Supplicant Support on an AP
Machine Auth User Auth Description Vlan Assigned Status
Prerequisites
To view the 802.1x authentication details on the controller
Provisioning an AP as a 802.1X Supplicant
Creating the Student Role and Policy
Sample Configurations
Configuring Authentication with an 802.1X Radius Server
Configuring Roles and Policies
Can use the alias for other rules and policies
Creating the Faculty Role and Policy
Using the WebUI
Creating the Guest Role and Policy
Under Time Range, select working-hours
Using the WebUI to create the computer role
Configuring the Radius Authentication Server
Creating Roles and Policies for Sysadmin and Computer
Creating an Alias for the Internal Network Using the CLI
Select Enforce Machine Authentication
Configuring 802.1X Authentication
Configuring VLANs
Configuring the Guest Wlan
Configuring the WLANs
Navigate to the Configuration Wireless AP Configuration
AP Group list, click Edit for the first-floor
Configuring the Non-Guest WLANs
CLI
Configuring a Server Rule Using the CLI
Configuring a Server Rule Using the WebUI
Select Termination
Configuring WLANs
Configuring the Guest Wlan
Configuring the Non-Guest WLANs
802.1x Logon
Configuring Mixed Authentication Modes
Authentication
Describes the different authentication possibilities
Configuring Reauthentication with Unicast Key Rotation
Performing Advanced Configuration Options for
Stateful and WISPr Authentication
Working With Stateful Authentication
Understanding Stateful Authentication Best Practices
Working With WISPr Authentication
Configuring Stateful 802.1x Authentication
Configuring Stateful Ntlm Authentication
Configuring Stateful Kerberos Authentication
Configuring WISPr Authentication
Profiles list, expand the WISPr Authentication Profile
Dell PowerConnect W-Series ArubaOS 6.2 User Guide 227
Certificate Revocation
Configuring a Controller as Ocsp and CRL Clients
Configuring an Ocsp Controller as a Responder
Understanding Ocsp and CRL
Navigate to the Configuration Management Certificates Upload
Configuring the Controller as an Ocsp Client
Select the Revocation Checkpoint tab
Configuring the Controller as a CRL Client
Configuring the Controller as an Ocsp Responder
Select Enable next to Enable Ocsp Responder
Understanding Captive Portal
Captive Portal Authentication
Controller Server Certificate
Configuring Captive Portal in the Base Operating System
Navigate to the Configuration Management General
Policy Enforcement Firewall Next Generation Pefng License
WebUI
CLI
Using Captive Portal with a Pefng License
To configure captive portal with Pefng license via the WebUI
Configuring Captive Portal in the WebUI
Configuring Captive Portal in the CLI
Sample Authentication with Captive Portal
Creating a Guest User Role
Creating a Time Range
Configuring Policies and Roles in the WebUI
Select Add to add the guest-logon-access policy
Creating an Auth-guest User Role
To configure the auth-guest-access policy via the WebUI
Creating an Auth-Guest-Access Policy
Creating Aliases
To create the block-internal-access policy via the WebUI
Creating an Block-Internal-Access Policy
To create a guest role via the WebUI
Creating a Drop-and-Log Policy
Creating a Guest Role
To create the drop-and-log policy via the WebUI
To create the guest-logon role via the WebUI
Configuring Policies and Roles in the CLI
Creating an Auth-Guest Role
Defining a Time Range
Creating a Guest-Logon Role
Configuring Guest VLANs
Creating a Guest-Logon-Access Policy
Creating a Block-Internal-Access Policy
Click Add For Vlan ID, enter Click Apply
Configuring Captive Portal Authentication Profiles
Modifying the Initial User Role
Configuring the AAA Profile
Managing User Accounts
Configuring the Wlan
Role
Configuring Captive Portal Configuration Parameters
Unauthenticated that a guest cannot access
Utilization Logon Threshold Default 60% Logon wait
Following are optional captive portal configurations
Enabling Optional Captive Portal Configurations
Specify the fac-logon user
Uploading Captive Portal Pages by Ssid Association
Changing the Protocol to Http
Entity Engineering Business Faculty
L3 Authentication
Configuring Redirection to a Proxy Server
Security Access Control Policies
Redirecting Clients on Different VLANs
For captive portal with role-based access
For captive portal with Pefng license
Personalizing the Captive Portal
Web Client Configuration with Proxy Script
Select the Your Custom Background
To customize the page background
Creating a New Internal Web
Creating and Installing an Internal Captive Portal
Variable
Password Example
Username Example
Fqdn Example
Displaying Authentication Error Messages
Installing a New Captive Portal
Basic Html Example
Configuring Localization
Reverting to the Default Captive Portal
This should be replaced with a link like the following
Insert javascript to handle error cases
This should be replaced with a link like this
Div id=errorbox style=display none /div
Sample Translated
Customizing the Welcome
Customizing the Pop-Up box
Customizing the Logged Out Box
Navigate to Advanced Services Stateful Firewall Destination
Creating Walled Garden Access
Configuring the Login URL
Configuring the Redirect-URL
Enabling Captive Portal Enhancements
Associating a Whitelist to Captive Portal Profile
Configuring a Whitelist
Configuring the Netdestination for a Whitelist
Defining Netdestination Descriptions
Verifying Dynamic ACLs for a Whitelist
Verifying a Whitelist Configuration
Use the following commands to verify the whitelist alias
Verifying a Captive Portal Profile Linked to a Whitelist
TOS
Verifying DNS Resolved IP Addresses for Whitelisted URLs
Example
Virtual Private Networks
Planning a VPN Configuration
384 Suite-B certificates ECDSA-256, ECDSA-384
Selecting an IKE protocol
Understanding Suite-B Encryption Licensing
IKE Policies Suite-B for IPsec tunnels
Understanding Supported VPN AAA Deployments
Working with IKEv2 Clients
VPN Client
Working with VPN Authentication Profiles
Parameter Default Default-rap Default-cap
Working with Certificate Groups
Configuring a Basic VPN for L2TP/IPsec in the WebUI
Enabling Source NAT
Defining Authentication Method and Server Addresses
Navigate to Configuration IP NAT Pools
Defining Address Pools
Defining IKEv1 Shared Keys
Configuring IKE Policies
Finalizing WebUI changes
Setting the IPsec Dynamic Map
Create address pools
Configuring a VPN for L2TP/IPsec with IKEv2 in the WebUI
Enable authentication methods for IKEv1 clients
Configure source NAT
Defining Address Pools
PRF-HMAC-MD5 PRF-HMAC-SHA1 PRF-HMAC-SHA256
PRF-HMAC-SHA384
Define IKEv2 Policies
Configuring a VPN for Smart Card Clients
Working with Smart Card clients using IKEv2
Enable authentication methods for IKEv2 clients
Working with Smart Card Clients using IKEv1
Configuring a VPN for Clients with User Passwords
Select Enable L2TP
Configuring VPNs for XAuth Clients using Smart Cards
Configuring Remote Access VPNs for XAuth
Click Add User
Certificates or Common Name as it appears on the certificate
Working with Remote Access VPNs for Pptp
Working with Third-Party Devices
Working with Site-to-Site VPNs
Working with Site-to-Site VPNs with Dynamic IP Addresses
Configuring Site-to-Site VPNs
Understanding VPN Topologies
Show crypto-local pki servercert certname subject
Click Doneto activate the changes Click Apply
For certificate authentication
For the Pre-shared-key for All FQDNs
For preshared key authentication
Detecting Dead Peers
For the Pre-shared-key
Working with VPN Dialer
Understanding Default IKE policies
Assigning a Dialer to a User Role
Configuring VPN Dialer
Host config #user-role role dialer name
Roles and Policies
Configuring Firewall Policies
Support for Desktop Virtualization Protocols
Working With Access Control Lists ACLs
Creating a Firewall Policy
IP address of the host
Configure the NAT pool in the controller
This can be one of the following
White List
When it leaves the controller
Queue in which a packet matching this rule should be placed
Pause ARM
Creating an ACL White List
Creating a Network Service Alias
Use the following CLI command to create ACL White Lists
Configuring the ACL White List in the WebUI
Configuring the White List Bandwidth Contract in the CLI
Configuring the ACL White List in the CLI
Creating User Roles
Bandwidth Contracts
Creating a User Role
Click the Delete button against the role you want to delete
Assigning a Bandwidth Contract to a User Role in the WebUI
Configuring a Bandwidth Contract in the WebUI
Configuring and Assigning Bandwidth Contracts in the CLI
Bandwidth Contract Exceptions
Viewing the Current Exceptions List
Configuring Bandwidth Contract Exceptions
Assigning User Roles
Assigning User Roles in AAA Profiles
Dhcp server
Working with User-Derived VLANs
Rule Type Condition Value
Equals String
Understanding Device Identification
Configuring a User-derived Vlan in the WebUI
Dhcp Option Description Hexadecimal Equivalent
User-Derived Role Example
Configuring a User-derived Role or Vlan in the CLI
See for descriptions of these parameters
Navigate to the Configuration Security Authentication
Configuring a Default Role for Authentication Method
Controller’s log files
Monitor TCP SYN Attack rate
Configuring a Server-Derived Role
Configuring a VSA-Derived Role
Understanding Global Firewall Parameters
Portal configuration
Or disabled
Log Icmp Errors
Default Disabled stateful SIP processing is enabled
Default Disabled FTP server is enabled
Session Idle Timeout sec
Default 15 seconds
Disable FTP Server
Session mirror Ipsec
Session-tunnel FIB Enable session,tunnel based forwarding
Mbps Default 1 Mbps Rate limit CP auth process traffic
Mbps Is 1-200 Mbps Default 1 Mbps
Page
Wlan Profiles Default AP Group Toronto AP Group
Configuring Virtual AP Profiles
Virtual APs
Excluding a Virtual AP Profile From an AP in the WebUI
Configuring a Virtual AP
Excluding a Virtual AP Profile From an AP in the CLI
Ssid profile guest
Configuring the User Role
Building3-lobby Guest
Deny Time Range
Configuring Authentication
Configuring Authentication Servers
Done
Side of the network. This feature is enabled by default
Users. The default role for unauthenticated users is logon
MAC Authentication Default Role
Wired to Wireless Roaming
Enforce Dhcp
Click Edit for the default AP group
Select Wireless LAN under Profiles, then select Virtual AP
Applying the Virtual AP
Enforcement, 802.11k and station blacklisting
Forward mode
Can be configured in tunnel mode
Campus APs in decrypt-tunnel forward mode
Band Steering
Enable this setting
Click the Global Setting tab
Setting on each individual local controller
APs. Default Disabled
Default 6 stations
Default 3600 seconds 1 hour
Authentication Failure
Creating a new Ssid Profile
Select Wireless LAN underProfiles, then select Virtual AP
XSec license in each controller
Keys
Dtim Interval
Period to receive broadcasts
Other wireless clients are transmitting
Default value is 2333 bytes
Powersave WMM Tspec Min
At the lowest configured rate
Frames is disabled
Battery Boost
Lengthening battery life
Configuring an Ssid for Suite-B Cryptography
Configuring a Vlan
Configuring a Guest Wlan
Configuring a Guest Role
Select Virtual AP
Configuring a Guest Virtual AP
To enable bSec Ssid using bSec-128 or bSec-256
Sample Configuration
Enabling bSec Ssid Support
Enabling 802.11k Support
Advertise 802.11K Capability
Measurement Mode for Beacon Reports
Measurement Report Mode field
Default Mode beacon-table
TSM Report Request Settings Profile
Handover Trigger Feature Settings Profile
Handover of Voice Clients’ feature
Beacon Report Request Settings Profile
Working with Radio Resource Management Information Elements
Working with Beacon Report Requests
Randomization Interval
Con when Measurement Mode is set to Active-Channel Report
Measurement Mode for
Range from 0 to 255. The default value is
Number of repetitions
Gered. When the triggered option is selected,
Request frame. The default value is enabled
Working with a Traffic Stream Measurement Report
Bin 0 Range
Configuring a High-Throughput Virtual AP
Range 0, 65535. The default value is
Range 0, 255. The default value is
40MHz intolerance
Select the 802.11a radio profile
Select the 802.11g radio profile
Transmission
Maximum number of spatial
Capabilities
Streams usable for Stbc
Supported MCS set
Mode Is enabled by default
Short guard interval in 20 MHz
Short guard interval in 40 MHz
Managing High-Throughput Profiles
Adaptive Radio Management ARM
Understanding ARM
Understanding ARM Application Awareness
Configuring ARM Scanning
ARM Support for 802.11n
Monitoring Your Network with ARM
Select RF Management to expand the RF Management section
Configuring ARM Profiles
Creating a New ARM Profile
ARM Profiles Example Wlan Description
Select Adaptive Radio Management ARM Profile
Configuring ARM Settings
Copying an Existing Profile
Deleting a Profile
Setting Description
Default 8 scans
That Scanning is also enabled
Power Save
Aware Scan Mode Default disabled Video Aware
Client Aware setting is disabled
Default 9 dBm
Scan That Scanning is also enabled
Enabled, that device will ignore this setting
Time Channel change Default 30 seconds Noise Threshold
Default 240 seconds
Error Rate
Threshold Change Default 50% Error Rate Wait
Scanning if the load for the AP gets too high
Default 1250000 Bps
Mode Aware
Load Aware
Assigning an ARM Profile to an AP Group
Select Configuration AP Configuration
Enabling Band Steering
Using Multi-Band ARM for 802.11a/802.11g Traffic
Steering Modes
To disable band steering, include the no parameter
Select Wireless LAN to expand the Wireless LAN section
Enabling Band Steering
Select QoS to expand the QoS section
To configure traffic shaping via the WebUI
Enabling Traffic Shaping
Enabling Traffic Shaping
Enabling Spectrum Load Balancing
To disable traffic shaping, use the default-accessparameter
Configuring Non-802.11 for Noise Interference Immunity
Reusing Channels to Control RX Sensitivity Tuning
ARM Metrics
Too many APs on the Same Channel
Troubleshooting ARM
Wireless Clients Report a Low Signal Level
Transmission Power Levels Change Too Often
APs Don’t Change Channels Due to Channel Noise
APs Detect Errors but Do Not Change Channels
Working with the Reusable Wizard
Wireless Intrusion Prevention
This chapter contains the following sections
Understanding Wizard Intrusion Detection
Protection features for Wlan clients
Protecting Your Infrastructure
Understanding Wizard Intrusion Protection
Protecting Your Clients
WIP Wizard Intrusion Protection
Monitoring the Dashboard
Classification Description
Detecting Rogue APs
Understanding Classification Terminology
Understanding Classification Methodology
Understanding Match Types
Understanding Match Methods
Understanding Suspected Rogue Confidence Level
Understanding Rule Matching
Understanding AP Classification Rules
Working with Intrusion Detection
Feature Command Trap Syslog ID
Understanding Infrastructure Intrusion Detection
126086
Ids impersonation-profile WlsxAPSpoofingDetected 126069
Detect-bad-wep WlsxStaRepeatWEPIVViolation 126016
Ids impersonation-profile
Detect-malformed-large-duration Detected
Require-wpa WlsxChannelMisconfiguration 127028
Ids unauthorized-device-profile WlsxWirelessBridge 126036
Detect-wireless-bridge Wireless-bridge-quiet-time
Detecting Ad hoc Networks
Detecting an 802.11n 40MHz Intolerance Setting
Detecting Active 802.11n Greenfield Mode
Detecting an Ad hoc Network Using a Valid Ssid
Detecting an RTS Rate Anomaly
Detecting Bad WEP Initialization
Detecting a Beacon Frame Spoofing Attack
Detecting a Client Flood Attack
Detecting Malformed Frame-Auth
Detecting a Misconfigured AP
Detecting a Wireless Bridge
Detecting Broadcast Deauthentication
Detecting Wellenreiter
Understanding Client Intrusion Detection
Ids dos-profile WlsxOmertaAttack 126071
Ids dos-profile WlsxPowerSaveDoSAttack 126109
Detect-power-save-dos-attack
Detect-hotspotter-attack Hotspotter-quiet-time
Detecting a Disconnect Station Attack
Detecting a Meiners Power Save DoS Attack
Detecting a Block ACK DoS
Detecting a ChopChop Attack
Detecting Unencrypted Valid Clients
Detecting an Omerta Attack
Detecting Rate Anomalies
Detecting a Tkip Replay Attack
Understanding Infrastructure Intrusion Protection
Configuring Intrusion Protection
Understanding Client Intrusion Protection
Protecting Windows Bridge
Configuring the Wlan Management System WMS
Navigate to the Configuration Advanced Services Wireless
Protecting Valid Stations
Station Ageout Interval
Configuring Local WMS Settings
Not configured
Managing the WMS Database
Methods of Blacklisting
Understanding Client Blacklisting
Blacklisting Manually
Captive portal
Blacklisting by Authentication Failure
Enter a value in the Max Authentication failures field
Enabling Attack Blacklisting
Profiles list, expand the IDS menu, then select IDS profile
Working with WIP Advanced Features
Setting Blacklist Duration
Removing a Client from Blacklisting
Understanding TotalWatch Channel Types and Qualifiers
Configuring TotalWatch
Frequency Channel
Understanding TotalWatch Monitoring Features
Understanding TotalWatch Scanning Spectrum Features
Understanding TotalWatch Channel Dwell Time
Understanding TotalWatch Channel Visiting
Administering TotalWatch
Configuring Per Radio Settings
Configuring Per AP Setting
DOS
Licensing
Configuring Tarpit Shielding
Understanding Tarpit Shielding Licensing CLI Commands
Working with Tarpit Shielding
Following topics are included in this chapter
Basic Functions and Features
Access Points APs
Function
Naming and Grouping APs
You can use the WebUI or the CLI to create a new AP group
Use the following command to create an AP group
Creating an AP group
Assigning APs to an AP Group
Working with Wireless LAN Profiles
Understanding AP Configuration Profiles
Click Apply and Reboot
Page
Page
Working with QoS Profiles
Working with AP Profiles
Provisioning Mesh Profiles
Working with RF Management Profiles
Profile Hierarchy
Viewing Profile Errors
Other Profiles
AP Specific and AP Group Profile Hierarchies
Other Profile Hierarchies
Verifying that APs Can Connect to the Controller
Configuring Firewall Settings
Deploying APs
Running the RF Plan
Configuring Dhcp Server Communication with APs
Configuring DNS Resolution
Enabling Controller Discovery
Navigate to the Configuration Network IP Dhcp Server window
Using the Aruba Discovery Protocol ADP
Verifying that APs Are Receiving IP Addresses
AP92 4GHz or 5GHz
Provisioning APs for Mesh
Provisioning 802.11n APs for Single-Chain Transmission
AP Model Freqency Band Antenna Port
AP134 4GHz or 5GHz
Installing APs on the Network
AP Model Freqency Band
5GHz
Working with the AP Provisioning Wizard
Provisioning Installed APs
Updating the RF Plan
Designation an AP as Remote RAP versus Campus CAP
Provisioning an Individual AP
AP Provisioning Window
Page
LMS or backup LMS values
Provisioning Multiple APs using a Provisioning Profile
AP is associated
Assigning Provisioning Profiles
AP Installation Modes
Configuring a Provisioned AP
Troubleshooting
Renaming an AP
Clear gap-db wired-mac
To configure the bootstrap threshold using the WebUI
Configuring the Bootstrap Threshold
Optimize APs Over Low-Speed Links
LMS IPv6 Backup LMS IPv6 LMS Preemption
RF Band for AM Mode scanning
Configuring split-tunnel forwarding
Backup LMS IP
When an AP process crashes
Bootstrap threshold
From a wireless client that is connected to a tunneled Ssid
Wireless frame is only encapsulated inside the IPsec tunnel
Prioritizing AP heartbeats
AP Redundancy
AP Maintenance Mode
Energy Efficient Ethernet
To enable AP maintenance mode
AP130 Series only
Managing AP LEDs
802.11a and 802.11g RF Management Profiles
RF Management
Radio
Managing 802.11a/802.11g Profiles Using the WebUI
Enable CSA
Creating or Editing a Profile
MHz and 40 MHz modes
Level 5 disable PHY reporting
Reuse feature
Balancing mode Select one of the following options
Radio Management ARM scanning and channel assignment
Load-balancing mode
Channel. The default CSA count is 4 announcements
Balancing threshold
Default, allowing 40 MHz operation
RX Sensitivity Tuning
RX sensitivity tuning based channel reuse threshold, in dBm
Signal strength
AM Scanning Profile
Assigning an 802.11a/802.11g Profile
Assigning a High-throughput Profile
Profile Spectrum monitor radio
Assigning an ARM Profile
Deleting a Profile
Managing 802.11a/802.11g Profiles Using the CLI
Creating or Modifying a Profile
Assigning a 802.11a/802.11g Profile
Viewing RF Management Settings
To view the settings of a specific RF management profile
RF Optimization
Maximum value 8 seconds
RF Event Configuration
Default value 0 seconds
Is sent to the client
Recommended value is 85%
Frame Error Rate High
Frame Error Rate Low
Detect Frame Rate Anomalies
Frame Retry Rate Low
Configuring AP Channel Assignments
Select the Regulatory Domain profile named default
Frame Retry Rate High
Channel Switch Announcement CSA
Automatic Channel and Transmit Power Selection
Managing AP Console Settings
IP address of the DNS server used by the AP
IP address of the AP’s master controller
Domain name used by the AP
Secure Enterprise Mesh
Understanding Mesh Access Points
Mesh Points
Mesh Portals
Mesh Clusters
Understanding Mesh Links
Optimizing Links
Link Metrics
Component Description
RF Management 802.11a and 802.11g Profiles
Understanding Mesh Profiles
Mesh Cluster Profile
Mesh Radio Profile
Adaptive Radio Management Profiles
Mesh High-Throughput Ssid Profile
High-Throughput Profiles
Wired AP Profile
Understanding Mesh Solutions
Mesh Recovery Profile
Point-to-Point Deployment
Thin AP Services with Wireless Backhaul Deployment
Point-to-Multipoint Deployment
Sample Point-to-Multipoint Deployment
High-Availability Deployment
Task Overview
Planning a Wlan According to Your Specifications
Collecting Required Information
AP Desired Rates 2.4 GHz Radio Properties
Building Dimensions
AM Desired Rates
Working with Mesh Radio Profiles
Managing Mesh Profiles In the WebUI
Creating a New Profile
AP goes through the list and uses the next highest rate
Threshold Nodes Default 10 missed heartbeats. The range is
Indicates the transmit rates for the 802.11a radio
Rates
Used for user traffic
Range 0-4094. Default 0 disabled
Default distributed-tree-rssi
Recommends using this default startup-subthresholdvalue
Link quality
Default 2,333 bytes. The range is 256- 2,346
Assigning a Profile to a Mesh AP or AP Group
Editing a Profile
To view the settings of a specific mesh radio profile
Viewing Profile Settings
Managing Mesh Profiles In the CLI
Deleting a Mesh Radio Profile
Working with Mesh High Throughput Ssid Profiles
Managing Profiles In the WebUI
Assigning a Profile to an AP Group
Launch then software retries
Temporal Diversity Enable
Enabled legacy stations are allowed
Configured value adjusts based on AP capabilities
Different values, separate each value with a comma
Mode Enabled by default
Μsec, 2 µsec, 4 µsec
Degrade throughput
Managing Profiles In the CLI
Deployments with Multiple Mesh Cluster Profiles
Viewing High-throughput Ssid Settings
To view the settings of a specific high-throughput profile
Understanding Mesh Cluster Profiles
Managing Mesh Cluster Profiles In the WebUI
Associating a Profile to Mesh APs
Deleting a Mesh Cluster Profile
Managing Mesh Cluster Profiles In the CLI
To view the settings of a specific mesh cluster profile
Viewing Mesh Cluster Profile Settings
Associating Mesh Cluster Profiles
To exclude a specific mesh cluster profile from an AP
Configuring Ethernet Ports for Mesh
Configuring Bridging on the Ethernet Port
Excluding a Mesh Cluster Profile from a Mesh Node
Configuring Ethernet Ports for Secure Jack Operation
Extending the Life of a Mesh Network
Outdoor AP Parameters
Provisioning Mesh Nodes
Provisioning Mesh Nodes
Under Port Selection, click the port to configure
IP settings section, select Obtain IP Address Using Dhcp
Provisioning Caveats
Booting the Mesh Portal
Understanding the AP Boot Sequence
Booting the Mesh Point
Verifying the Network
Verification Checklist
Air Monitoring and Mesh
CLI Examples
Configuring Remote Mesh Portals RMPs
Creating a Remote Mesh Portal In the WebUI
How RMP Works
Defining the Mesh Private Vlan
Provisioning the AP
Selecting an RF Management Profile
Selecting a Mesh Radio Profile
Adding a Mesh Cluster Profile
Configuring the Vlan ID of the Virtual AP Profile
Configuring a Dhcp Pool
Profile Details window
Additional Information
Provisioning a Remote Mesh Portal In the CLI
Configuring Redundancy Parameters
Configuring the Local Controller for Redundancy
Configuring the Master Controller for Redundancy
Configuring the LMS IP
On the master controller
Controllers. Specify a key of up to 64 characters
Command Explanation
Enter the master-redundancy context
Router ID of the Vrrp instance
This config mode command includes RF plan data when
Configuring Database Synchronization
Configuring Master-Local Controller Redundancy
Enabling Incremental Configuration Synchronization CLI Only
Redundant Topology Master-Local Redundancy
Vrrp Dell PowerConnect W-Series ArubaOS 6.2 User Guide
Understanding Rstp Migration and Interoperability
Disabled Discarding Blocking
Working with Rapid Convergence
Rstp 802.1w Description Port Role
Feature Default Value/Range
Configuring Rstp
Edge Port and Point-to-Point
Port Fast
Troubleshooting Rstp
Change the default configurations via the command line
Monitoring Rstp
Dell PowerConnect W-Series ArubaOS 6.2 User Guide Rstp
Enabling PVST+ in the CLI
Understanding PVST+ Interoperability and Best Practices
Enabling PVST+ in the WebUI
From the WebUI, add a Vlan instance and enable PVST+
IP Mobility
Understanding Dell Mobility Architecture
On all Dell controllers in the mobility domain
Configuring Mobility Domains
Enable mobility disabled by default
On a master controller
Configuring a Mobility Domain
Navigate to the Configuration Advanced Services IP Mobility
Example Configuration
Joining a Mobility Domain
On controller a the master controller
Configuring Mobility using the WebUI
Subnetwork Mask
Home Agent Address or Vrip
Tracking Mobile Users
Configuring Mobility using the CLI
Viewing mobile client status using the WebUI
Viewing mobile client status using the CLI
Status Type Description
Viewing user roaming status using the CLI
Viewing specific client information using the CLI
Roaming Description Status Type
HA Discovery on Association
Configuring Advanced Mobility Functions
Setting up mobility association Using the CLI
Mobile Client Roaming Locations
Enable standalone AP
Is 0-5000 visitors. The default setting is 5000 visitors
Default setting is 3 attempts
Seconds. The default setting is 5000 seconds
Click Apply after setting the parameter
Proxy Dhcp
Proxy Mobile IP
Revocations
Understanding Bridge Mode Mobility Deployments
Working with Proxy Igmp and Proxy Remote Subscription
Enabling Mobility Multicast
Working with Inter controller Mobility
Inter-controller Mobility
Configuring Mobility Multicast
Start at 0 from the left-most position
Enable Igmp proxy on the FastEthernet Ieee 802.3 interface
Enable Igmp snooping
Example
External Firewall Configuration
Understanding Firewall Port Configuration Among Dell Devices
Ports Used for Virtual Internet Access VIA
Enabling Network Access
Configuring Ports to Allow Other Traffic Types
Page
Remote Access Points
About Remote Access Points
Remote AP with a Private Network
Configure the NAT Device
Configuring the Secure Remote Access Point Service
Configure a Public IP Address for the Controller
Using the WebUI to create a DMZ address
You can use the CLI or the WebUI to configure Chap
Configure the VPN Server
Chap Authentication Support over PPPoE
Using the WebUI to configure Chap
Using the CLI to configure the Chap
Configuring Certificate RAP
Creating a Remote AP Whitelist
RAP Static Inner IP Address
Configuring PSK RAP
Using WebUI
Using CLI
IP-Address parameter in the local database
Provision the AP
Deployment Scenario Master IP Address Value
Deploying a Branch Office/Home Office Solution
Local Debugging
Configuring the Branch Office AP
Troubleshooting Remote AP
Provisioning the Branch Office AP
Basic View Information Advanced View Information Name
Multihoming on remote AP RAP
Seamless failover from backup link to primary link on RAP
Remote AP Connectivity
Remote AP Diagnostics
Enabling Remote AP Advanced Configuration Options
Data Description
Understanding Remote AP Modes of Operation
Remote Oper Forward Mode Setting Ation
SSIDs
Working in Fallback Mode
Only Ssid configuration Stored in flash on
Essid is up when Same behavior as Not supported AP contacts
Backup Configuration Behavior for Wired Ports
Configuring Fallback Mode
Configuring the AAA Profile for Fallback Mode in the WebUI
Configuring the AAA Profile for Fallback Mode in the CLI
Configuring the Dhcp Server on the Remote AP
Using the WebUI
Configuring the Session ACL in the WebUI
Configuring Advanced Backup Options
Configuring the AAA Profile in the WebUI
Route src-nat
Defining the Backup Configuration in the WebUI
Configuring the Session ACL in the CLI
Configure the Remote-AP Dhcp Server fields
You can define other parameters as needed
Specifying the DNS Controller Setting
Using the CLI to configure the AAA profile
Defining the Backup Configuration in the CLI
Backup Controller List
Configuring the LMS and backup LMS IP addresses in the CLI
Configuring Remote AP Failback
To disable, enter
Enabling RAP Local Network Access
Configuring Remote AP Authorization Profiles
To enable, enter
Adding or Editing a Remote AP Authorization Profile
Working with Access Control Lists and Firewall Policies
Understanding Split Tunneling
Sample Split Tunnel Environment
Configuring Split Tunneling
Configuring the Session ACL Allowing Tunneling
Configuring an ACL to Restrict Local Debug Homepage Access
Enable Restricted Access to LD Homepage
Configuring the AAA Profile for Tunneling
Inthe CLI
Configuring the Tunneling Virtual AP Profile
Navigate to Configuration Wireless AP Configuration
Provisioning Wi-Fi Multimedia
Defining Corporate DNS Servers
Reserving Uplink Bandwidth
Configuring Bandwidth Reservation
To configure bandwidth reservation
Navigate to Configuration Advanced Services All Profiles
Provisioning RAP for USB Modems
Provisioning 4G USB Modems on Remote Access Points
Navigate to Configuration Wireless AP Installation
4G USB Modem Provisioning Best Practices and Exceptions
RAP 3G/4G Backhaul Link Quality Monitoring
Pantech
Configuring W-IAP3WN Access Points
Converting IAP to RAP
Converting an IAP to RAP or CAP
Converting an IAP to CAP
Applying Contracts
Configuring Bandwidth Contracts for RAP
Enabling Bandwidth Contract Support for RAPs
Defining Bandwidth Contracts
Verifying Contracts Applied to Users
Verifying Contracts on AP
Verifying Bandwidth Contracts During Data Transfer
Following is a sample output for a per-user configuration
Page
Understanding VIA Connection Manager
Virtual Intranet Access
How it Works
User action / environment VIA’s behavior
Installing the VIA Connection Manager
On Microsoft Windows Computers
On Apple MacBooks
Complete Upgrade
Configuring the VIA Controller
Upgrade Workflow
Minimal Upgrade
Before you Begin
Supported Authentication Mechanisms
Authentication mechanisms supported in VIA
Other authentication methods
Suite-B
Configuring VIA Settings
Create VIA User Roles
Using the WebUI to Configure VIA
Enable VPN Server Module
Create VIA Authentication Profile
Enter a name for the server group
Create VIA Connection Profile
To create VIA connection profile
Configuration Option Description
Client Auto-Login
To the support email-address for troubleshooting
List of all IKEv2 authentication methods
Default None
Use Windows Credentials
Enable Supplicant
Enable Fips Module
VIA Authentication Name\username instead of just username
To configure VIA web authentication profile
Configure VIA Web Authentication
To associate a VIA connection profile to a user role
Configure VIA Client Wlan Profiles
To configure a VIA client Wlan profile
Associate VIA Connection Profile to User Role
Mschapv2-use-windows-credentials
Option Description
Cryptobinding TLV
Servers or trusted certification authorities
Download VIA Installer and Version File
Rebranding VIA and Downloading the Installer
To download the VIA installer and version file
Create VIA connection profiles
Using the CLI to Configure VIA
Create VIA authentication profiles
Create VIA roles
Requires the following Microsoft KB on the end-user systems
Customize VIA logo, landing page and downloading installer
Downloading VIA
Pre-requisites
Downloading VIA
Login to Download VIA
Using VIA
Installing VIA
Connection Details Tab
Diagnostic Tab
Troubleshooting
Settings Tab
AP104 Yes
Understanding Spectrum Analysis
Spectrum Analysis
Device
Hybrid AP?
Device Configurable as a
Graph Title
Graph Title Description Update Interval
Swept
Spectrum Analysis Clients
Spectrogram
Real-Time FFT
Creating Spectrum Monitors and Hybrid APs
Hybrid APs Using Mode-Aware ARM
Hybrid AP Channel Changes
Converting an Individual AP to a Spectrum Monitor
Converting APs to Hybrid APs
Select AP to expand the AP profiles section
Converting a Group of APs to Spectrum Monitors
Connecting Spectrum Devices to the Spectrum Analysis Client
To manually disconnect a spectrum monitor or hybrid AP
Disconnecting a Spectrum Device
View Connected Spectrum Analysis Devices
Table Column Description
Selecting a Spectrum Monitor
Configuring the Spectrum Analysis Dashboards
Click the Spectrum Dashboards tab
Click theSpectrum Dashboards tab
Changing Graphs within a Spectrum View
Saving a Dashboard View
Renaming a Spectrum Analysis Dashboard View
Select Rename
Resizing an Individual Graph
Customizing Spectrum Analysis Graphs
Active Devices
Spectrum Analysis Graph Configuration Options
Show
Channel Range
Column may display any of the following values
Service set identifier of the device’s 802.11 wireless LAN
Active Devices Table
Device Type
Select the button by the Less than drop down list
Select the button by the symbol
Radio band or channel
Column heading
MHz
Active Devices Trend
Detects on the radio channel
Center Frequency
Select one of the following device types
Wi-Fi data as non-Wi-Fi data
Channel Metrics
Show lines for these
Radio band displayed in this graph
Channel Metrics Graph
Channel Metrics Trend
Unselect the checkbox to hide that information
Drop-down list and select one of the following options
Minutes
Hour
Monitor
Channel Summary Table
Band Radio band displayed in this graph
Device Duty Cycle
Numbering Identify a channel numbering scheme for the graph
Channel Utilization Trend
Following device types
Uncheck the checkbox by that channel number
As non-Wi-Fi data
Devices vs Channel
Intervals
Devices vs Channel Options
FFT Duty Cycle
FFT Duty Cycle
Interference Power
Interference Power Options
Device types
Quality Spectrogram
Data
Real-Time FFT
Frequencies for the graph
Axis
Right field, and the higher value in the left field
Frequency Center of the x-axis of this chart Span
Swept Spectrogram
Center
Simple Line Graph of FFT Power Data
Swept Spectrogram Options
Working with Non-Wi-Fi Interferers
Device vs Channel Interference Power
Non-Wi-Fi Description Interferer
Viewing Spectrum Analysis Data
Understanding the Spectrum Analysis Session Log
Creating a Spectrum Analysis Record
Recording Spectrum Analysis Data
To record spectrum analysis data for later analysis
To save the recording file
Saving the Recording
Playing a Spectrum Analysis Recording
Playing a Recording in the Spectrum Dashboard
Click the Recording View/Play link at the top of the window
Playing a Recording Using the RFPlayback Tool
Click Load File For Playback
Loading a Spectrum View
Troubleshooting Spectrum Analysis
Troubleshooting Browser Issues
Converting a Spectrum Monitor Back to an AP or Air Monitor
Playing a Recording in the RFPlayback Tool
Understanding Spectrum Analysis Syslog Messages
Understanding Device Ageout Times
Hopper Seconds
Age Out Generic Fixed Frequency
Age Out Generic Frequency Hopper
APs
Monitoring Performance
Dashboard Monitoring
Clients
Monitoring Usage
Using Dashboard Histograms
Monitoring Security
Monitoring Potential Issues
Monitoring WLANs
Monitoring Clients
Monitoring Access Points
Element
To disable this setting, include the no parameter
Monitoring Firewalls
Element View
Column
Element Description
Bytes Tx Bytes Rx Bytes
User Bytes Packets Device Destination
Details View
Element Tab
Element Summary View
Application
Usage Breakdown
Usage Breakdown
Aggregated Sessions
Source IP
Column Description
Destination Alias
Management Access
Configuring Certificate Authentication for WebUI Access
Enabling Public Key Authentication for SSH Access
Select the client certificate Click Apply
Enabling Radius Server Authentication
Configuring Radius Server Authentication with VSA
Configuring a set-value server-derivation rule
Verifying the configuration
Disabling Authentication of Local Management User Accounts
Resetting the Admin or Enable Password
User admin Password
Bypassing the Enable Password Prompt
Configure the settings described in Table
Implementing a Specific Management Password Policy
Setting an Administrator Session Timeout
Defining a Management Password Policy
Allowed Characters Disallowed Characters
Period Pipe Plus sign + Tilde ~ Comma Accent mark `
Management Authentication Profile Parameters
Allowed Characters
Colon
About Digital Certificates
Managing Certificates
Enter the following information
Navigate to the Configuration Management Certificates CSR
Obtaining a Server Certificate
Parameter Description Range
PKCS7 encrypted PKCS12 encrypted
Run the following command
Obtaining a Client Certificate
Importing Certificates
Location Description
Use the following command to import CSR certificates
Viewing Certificate Information
Imported Certificate Locations
Checking CRLs
Configuring Snmp
Snmp Parameters for the Controller
Configuring Logging
Category/Subcategory Description
Logging Level Description
Category/Subcategory
802.1x messages Radius Radius user messages
Configuring the Guest Fields
Configuring the Guest Provisioning
Enabling Guest Provisioning
Guestcategory
Guest Field
Fields that follow
Configuring the Page Design
Guest Field Description
Provisioning page for the sponsor information
Configuring Email Messages
Configuring the Smtp Server and Port in the WebUI
Navigate to the Configuration Management SMTPpage
Click Apply and then Save Configuration
Configuring an Smtp server and port in the CLI
Creating Email Messages in the WebUI
Management Users section, click Add
Configuring a Guest Provisioning User
Username and Password Authentication Method
Static Authentication Method
Click Apply and Save Configuration
Customizing the Guest Access Pass
Smart Card Authentication Method
Username and Password Method
Customized Guest Account Information Window
Creating Guest Accounts
Creating a Guest Account-New Guest Window
Guest Provisioning User Tasks
Creating Multiple Guest Entries in a CSV File
Importing Multiple Guest Entries
CVS File Format-Guest Entries Information
Importing the CSV File into the Database
Importing a CSV file that contains Guest Entries
Displaying the Guest Entries Log File
Restricting one Captive Portal Session for each Guest
Optional Configurations
Printing Guest Account Information
Managing Files on the Controller
Setting the Maximum Time for Guest Accounts
Using the WebUI to set the maximum time for guest accounts
Using the CLI to set the maximum time for guest accounts
Username to log into server
Server Type Configuration
Navigate to the Maintenance Controller Image Management
Transferring ArubaOS Image Files
Copying Log Files
Backing Up and Restoring the Flash File System
Copying Other Files
Setting the System Clock
Manually Setting the Clock
Navigate to the Configuration Management Clock
Clock Synchronization
Configuring NTP Authentication
Timestamps in CLI Output
Enabling Capacity Alerts
Threshold Description
Examples
Sent. The default threshold for this parameter is 80%
User-capacity
Using the Initial Setup
Configuring Local Controllers
Adding Local Controllers
Using the Web UI
Configuring Layer-2/Layer-3 Settings
Configuring Trusted Ports
Configuring Local Controller Settings
Moving to a Multi-Controller Environment
Configuring APs
Using the WebUI to configure the LMS IP
Using the CLI to configure the LMS IP
Configuring a Preshared Key
Using the CLI to configure a PSK
Configuring a Controller Certificate
Using the WebUI to configure a Local Controller PSK
Using the WebUI to configure a Master Controller PSK
Using the CLI to configure the Master Controller Certificate
Advanced Security
Securing Client Traffic
Wireless xSec Client Example
Securing Wireless Clients
Securing Wired Clients
Navigate to the Configuration Advanced Services Wired Access
Securing Wireless Clients Through Non-Dell APs
Securing Clients on an AP Wired Port
Succeed
Time to wait for authentication to
Securing Controller-to-Controller Communication
Configuring Controllers for xSec
For Controller
Installing the Odyssey Client
Configuring the Odyssey Client on Client Machines
Modifying a regedit Policy
Certificate Information
Page
Voice and Video License Requirements
Configuring Voice and Video
Setting up Net Services
Using Default Net Services
Net Service Name Protocol Port
Configuring User Roles
Creating Custom Net Services
Using the Default User Role
Creating or Modifying Voice User Roles
Using the WebUI to configure user roles
Service Name
Navigate to the Configuration Security Access Control
Click Done Click Apply
Using the CLI to configure a user role
Using the WebUI to derive the role based on MAC OUI
Using the User-Derivation Roles
Using the WebUI to derive the role based on Ssid
Using the CLI to derive the role based on Ssid
Additional Video Configurations
Configuring Firewall Settings for Voice and Video ALGs
Configuring Video over Wlan enhancements
Pre-requisites
To enable Igmp snooping
To add the ACL to a user role
Configure multicast rate optimization for video traffic
Set a bandwidth percentage for the following categories
Configure and apply a bandwidth management profile
Enable Igmp Proxy
Enable multicast shaping on the firewall
Enable Igmp Snooping
Configure ARM scanning for video traffic
Configure multicast rate optimization for the video traffic
Working with QoS for Voice and Video
Configure and apply bandwidth management profile
This step is optional
Understanding VoIP Call Admission Control Profile
To enable call admission control in this profile
Understanding Wi-Fi Multimedia
Voip Tspec Enforcement
Lowest Background Best effort Video Voice Highest
Configuring WMM AC Mapping
Priority 802.1p Priority WMM Access Category
Enabling WMM
Using the WebUI to map between WMM AC and Dscp
Dscp Decimal Value WMM Access Category
Background Best effort Video Voice
Using the CLI to map between WMM AC and Dscp
Configuring Dscp Priorities
Enhanced Distributed Channel Access
Configuring Dynamic WMM Queue Management
WMM Access Category Description 802.1p Tag
Microseconds, enter 94 3008/32. Possible values are
Using the WebUI to configure Edca parameters
Disables this option
1. a value of 4 computes to 2 4-1 = 15. Possible values are
Using the CLI to configure Edca parameters
Enabling WMM Queue Content Enforcement
To associate the Edca profile instance to a Ssid profile
Port Packet Type
Understanding Extended Voice and Video Features
Microsoft OCS
Apple Facetime
Enabling Mobile IP Home Agent Assignment
Enabling WPA Fast Handover
Scanning for VoIP-Aware ARM
Disabling Voice-Aware
Configuring SIP Authentication Tracking
Viewing Real Time Call Quality Reports
To configure Real Time analysis on voice calls
Enabling Real Time Call Quality Analysis
Web UI
SIP session timer is implemented in the SIP ALG as per RFC
Enabling SIP Session Timer
To view the SIP settings on the controller
To configure the session timer and the timeout value
Click the Policies tab
Select the Classify Media check box
Enabling Wi-Fi Edge Detection and Handover for Voice Clients
Understanding Dial Plan Format
Expand Handover Trigger under Wireless Lan
Click the Apply button to save the configuration
Working with Dial Plan for SIP Calls
Action Description
Configuring Dial Plans
Dialplan Profile displays the dial plan details
Dialplan Profile
To view the SIP dial plan profile
Enabling Enhanced 911 Support
To create a voice dial plan profile
To associate the dial plan with SIP ALG
Working with Voice over Remote Access Point
Enabling Lldp
Understanding Battery Boost
Configure the Lldp profile parameters as desired then click
Show the power support capabilities of the AP interface
Lldp PDUs. The AP will send all optional TLVs by default
Lldp PDUs. The AP will send all 802.1 TLVs by default
Lldp PDUs. The AP will send all 803.2 TLVs by default
LLDP-MED Profile Configuration Parameters
Apply to save your settings
Viewing Troubleshooting Details on Voice Client Status
Advanced Voice Troubleshooting
Connected
To view the details of a completed call based on the CDR Id
Viewing Troubleshooting Details on Voice Call CDRs
Enabling Voice Logs
Navigate to the Configuration Management Logging
Enabling Logging for a Specific Client
To debug voice logs for a specific client
To view the voice signaling message traces
Viewing Voice Traces
To set the voice logging level to debugging
To view the voice configuration details on your controller
Viewing Voice Configurations
SIP settings Value Parameter
Termination of Instant AP VPN tunnels
L2/L3 network mode support
Overview
Instant AP VPN Support
External Whitelist DB
VPN Configuration
Whitelist DB Configuration
Controller Whitelist DB
Radius proxy for VPN connected IAPs
VPN Local Pool Configuration
VPN Profile Configuration
Viewing Branch Status
Output of this command includes the following parameters
USB Ports
Understanding W-600 Series Best Practices and Exceptions
Series Controllers
Controller
Switching Modes
Connecting with a USB Cellular Modems
Finding USB Modem Commands
Cellular Profile
Uplink Manager
Cellular Profile from the WebUI
Dialer Group
Verify the modem is registered with the Uplink Manager
Configuring a Supported USB Modem
Configuring the Profile and Modem Driver
Configuring a New USB Modem
If you get entries similar to the example below
Driver=none
Configuring the TTY Port
Selecting the Dialer Profile
Testing the TTY Port
NAS Device Setup
Setting Up NAS Network-Attached Storage Devices
Linux Support
Managing NAS Devices
Configuring in the CLI
View list of shares in a disk
NAS Media Green-solid Press and hold media
Mounting and Unmounting Devices
Controller wake-up Green-solid Button
To view a list of printers mounted on the controller, type
Connecting to a Print Server
Printer Setup Using the CLI
Additional Commands for Managing Printers
Remote Branch 1-W-650 Controller
Series Sample Topology and Configuration
Remote Branch 2-W-650 Controller
Central Office Controller-Active
Central Office Controller-Backup
Page
Sample ESI Topology
External Services Interface
ESI-Fortinet Topology
ESI Parser Domains
Understanding the ESI Syslog Parser
Syslog Parser Rules
Peer Controllers
Condition Pattern Matching
Configuring ESI
User Pattern Matching
Defining the ESI Server
Configuring Health-Check Method, Groups, and Servers
Enter a Profile Name
Enter a Group Name
To configure an ESI server group on the controller
Defining the ESI Server Group
Server Name
Redirection Policies and User Role
Deleting an existing syslog parser domain
ESI Syslog Parser Domains and Rules
Managing Syslog Parser Domains in the WebUI
Adding a new syslog parser domain
Editing an existing syslog parser domain
Use these CLI commands to manage syslog parser domains
Managing Syslog Parser Domains in the CLI
Managing Syslog Parser Rules
Deleting a syslog parser rule
Adding a new parser rule
Editing an existing syslog parser rule
Use these CLI commands to manage syslog parser rules
Testing a Parser Rule
Monitoring Syslog Parser Statistics
Sample Route-mode ESI Topology
Showing ESI syslog parser rule information
ESI server configuration on controller
Configuring the Example Routed ESI Topology
IP routing configuration on Fortinet gateway
Defining the Ping Health-Check Method
Health-Check Method, Groups, and Servers
Enter a Group Name. Enter fortinet
Trusted IP Address. Enter Untrusted IP Address. Enter
Redirection Policies and User Role
To add a new syslog parser domain for the routed example
Syslog Parser Domain and Rules
Add a New Syslog Parser Domain in the WebUI
Adding a New Parser Rule in the WebUI
Example NAT-Mode Topology
Sample NAT-mode ESI Topology
ESI server configuration on the controller
Profile Name. This example uses externalcpping
Configuring the Example NAT-mode ESI Topology
Configuring the NAT-mode ESI Example in the WebUI
Configuring the ESI Group in the WebUI
Policy Name. This example uses cpredirectacl
Configuring the Example NAT-mode Topology in the CLI
Configure the ESI Servers in the WebUI
Configuring the Redirection Filter in the WebUI
CLI Configuration Example
Configuring a Health-Check Ping
Configuring ESI Servers
Using the ESI Group in a Session Access Control List
Character-Matching Operators
Understanding Basic Regular Expression BRE Syntax
Regular Expression Anchors
Regular Expression Repetition Operators
Description Sample Result
References
External User Management
Working with the ArubaOS XML API Works
Deleting a User
Authenticating a User
Creating an XML Request
Adding a User
Blacklisting a User
Default Response Format
Format of a default XML response from the controller is
XML Response
Code Reason message
Response Codes
Code Reason message Description
Query Command Response Format
Associating the XML API Server to a AAA profile
Using the XML API Server
Configuring the XML API Server
Verify the XML API server configuration
Vlan
Associating the Captive Portal Profile to an Initial Role
Set up Captive Portal profile
Dell controllers configuration
Authentication Command Description
Options Description Range / Defaults
This command deletes the user from the controller
Monitoring External Captive Portal Usage Statistics
Sample Code
Using XML API in C Language
Page
Page
Understanding XML API Request Parameters
Understanding Request and Response
List all parameter that you can use in a request
Response from the controller
This command will add a client on your network
Understanding XMl API Response
Adding a Client
View the updated details of the client on the controller
Authenticating a Client
Deleting a Client
Sending the authentication command
Status of the client before authentication
Status of the client after authentication
Querying for Client Details
Blacklisting a Client-request and response
Blacklisting a Client
RF Plan
Supported Planning
Outdoor-Specific Deployment Considerations
Configuration Considerations
Planning Deployment
Pre-Deployment Considerations
Dual-Port AP Considerations
Post-Deployment Considerations
Campus List
Launching the RF Plan
Buttons Description
Buttons
Building List Pane
Edit a campus from the building list pane
Building Dimension
Building Specifications Overview
AP Modeling Parameters
Radio Type
Overlap Factor
Design Model
Radio Description Button
Radio Property Description
Users/AP
Radio Properties Desired Rates and HT Support Options
Overlap Description Factor
Number of available channels
AM Modeling
Valid values are 54, 48, 36, 24, 18, 12, 9, 6, 11, 5.5, 2
Radio Button Description
Planning Floors
Design Models
Monitor Rates
Zoom
You can select or adjust the features as described in Table
Naming
Approximate Coverage Map
Floor Editor Dialog Box
Level
Background Images
Area Editor Dialog Box
Area Types
Location and Dimensions
Fixed
Access Point Editor Dialog Box
Y Coordinates
Power Levels
802.11n Features
Radio Types
Memo
AP Plan
Initialize
Optimize
Fix All Suggested AP/AMs
AM Plan
Viewing the Results
Exporting and Importing Files
Import Campus
Export Campus
Export Buildings
Import Buildings
Locate
Property Description
Fqln Mapper
Search Results
Using the Fqln Mapper in the AP Provision
Height
Using the WebUI
RF Plan Example
Sample Building
Create a Building
Campus Name
Model the Access Points
Text Box
Information
Adding the background image and naming the second floor
Model the Air Monitors
Add and Edit a Floor
Adding the background image and naming the first floor
Running the AP Plan
Creating a Don’t Deploy Area
Click Initialize then Optimize
Running the AM Plan
Click Initialize
Click Optimize
Behavior and Defaults
Understanding Mode Support
Forwarding Mode Feature Not Supported
Network Services
Understanding Basic System Defaults
Name Protocol
Name Protocol Ports
Predefined Policy Description
Policies
Following are predefined policies
Network access. You can use this rule to
Used to enable the captive portal logout
Access the controllers administrative
Be modified. It permits APs to boot up
This policy can be used to source-NAT all
Permits all DNS traffic
NAT-T UDP 4500. Remove NAT-T if not
Needed
Predefined Role Description
Roles
Following are predefined roles
Profiles with different customization
Enables captive portal
Should be disabled if it is not needed
Beginning
Predefined Role Permissions
Understanding Default Management User Roles
ArubaOS software includes predefined management user roles
Show wlan-ap-count type access-points
Show aaa state configuration
Show aaa authentication-server all
Show switches summary
Monitoring Controller Clients Packet CaptureMonitoring
Port Protocol Where Used Description Number
Understanding Default Open Ports
Exposed to wireless users
Controller Remote wired MAC lookup 4343
Testing
Port is not exposed to wireless users
Dhcp with Vendor-Specific Options
Configuring a Windows-Based Dhcp Server
Configuring Option
To configure option 60 on the Windows Dhcp server
Field Information
To configure option 43 on the Windows Dhcp server
Scope Options Dialog Box
Enabling Dhcp Relay Agent Information Option Option
Navigate to Configuration Network IP IP Interfaces
Enabling Linux Dhcp Servers
Range 10.200.10.200
802.1X Configuration for IAS and Windows Clients
Configuring Microsoft IAS
Radius Client Configuration
Configuring Policies
Remote Access Policies
Active Directory Database
Click Configure to select additional properties
IAS Remote Access Policies
Policy Configuration Wizard-Authentication Methods
Radius class Attribute Configuration
Configuring Radius Attributes
Creating a Remote Policy
Configuring Management Authentication using IAS
Next, create a remote policy for your new Radius client
Creating a User Entry in Windows Active Directory
Defining Properties for Remote Policy
Configuring a Server Group for IAS Management Authentication
Navigate to DiagnosticsAAA Test Server
Window XP Wireless Client Sample Configuration
Click Begin Test
Wireless Networks
Networks to Access
Wireless Network Association
Wireless Network Authentication
Protected EAP Properties
EAP MSCHAPv2 Properties
Definition
Acronyms
Acronyms and Terms
Acronym
DoS
Acronym
MSCHAPv2
RoW
PoE
PPPoE
QoS
VoFI VoIP
XAuth
Terms
Term
WISPr
Term
Term Definition
IR wireless
Encryption authentication
Fixed wireless
Shops are providing free wireless access for customers
Near field communicationNFC
Optical wireless
Hills, mountains, and large human-made structures
Input, multiple output
Standards for broadband wireless access BWA networks. WiMAX
Access W-CDMA
Wi-Fi
Facilities offer public access to Wi-Fi networks
Yagi antenna
Wireless service provider
Wired LAN
Kilometers