Operation
•To view graphical logs:
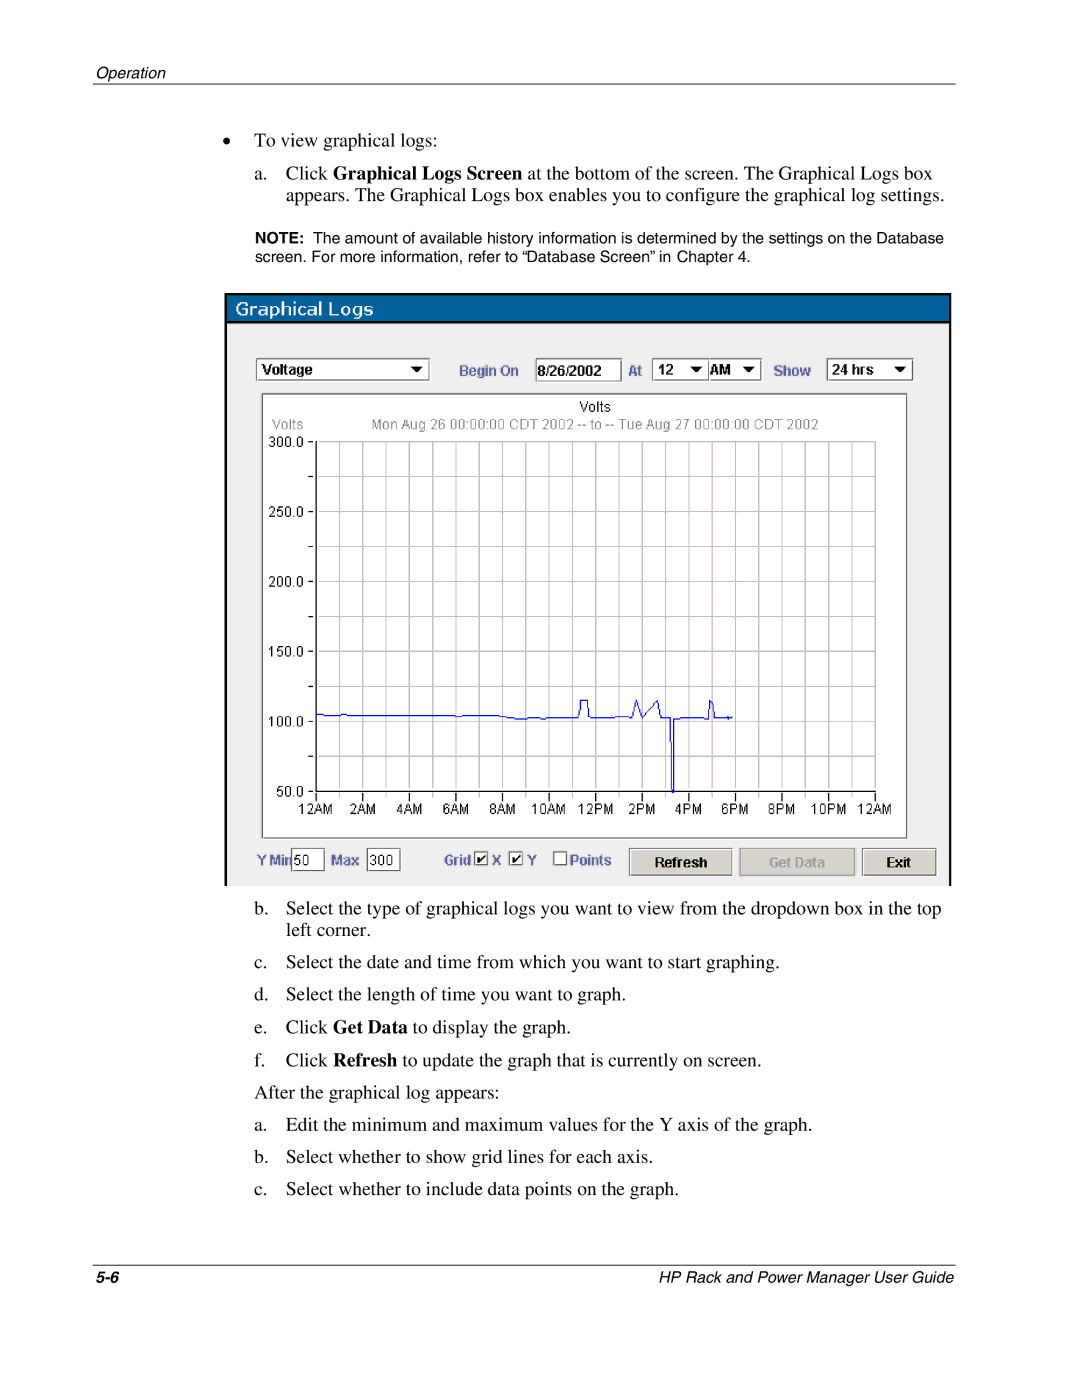
a.Click Graphical Logs Screen at the bottom of the screen. The Graphical Logs box appears. The Graphical Logs box enables you to configure the graphical log settings.
NOTE: The amount of available history information is determined by the settings on the Database screen. For more information, refer to “Database Screen” in Chapter 4.
b.Select the type of graphical logs you want to view from the dropdown box in the top left corner.
c.Select the date and time from which you want to start graphing.
d.Select the length of time you want to graph.
e.Click Get Data to display the graph.
f.Click Refresh to update the graph that is currently on screen.
After the graphical log appears:
a.Edit the minimum and maximum values for the Y axis of the graph.
b.Select whether to show grid lines for each axis.
c.Select whether to include data points on the graph.
HP Rack and Power Manager User Guide |