iIS Console Trace Window
For example, an iIS message filter for a primary engine unit might be as follows:
FORTE_LOGGER_SETUP: "%stdout(trc:cr:2:2)"
This filter specifies that all messages about sessions created in the engine
If you do not specify any iIS message filters, none are set by default.
Using the iIS Console Trace Window
You can use the iIS Console trace window to select and display messages generated by iIS process engine components and to view exception output. Using the trace window, you can monitor engines distributed throughout your environment from one central location.
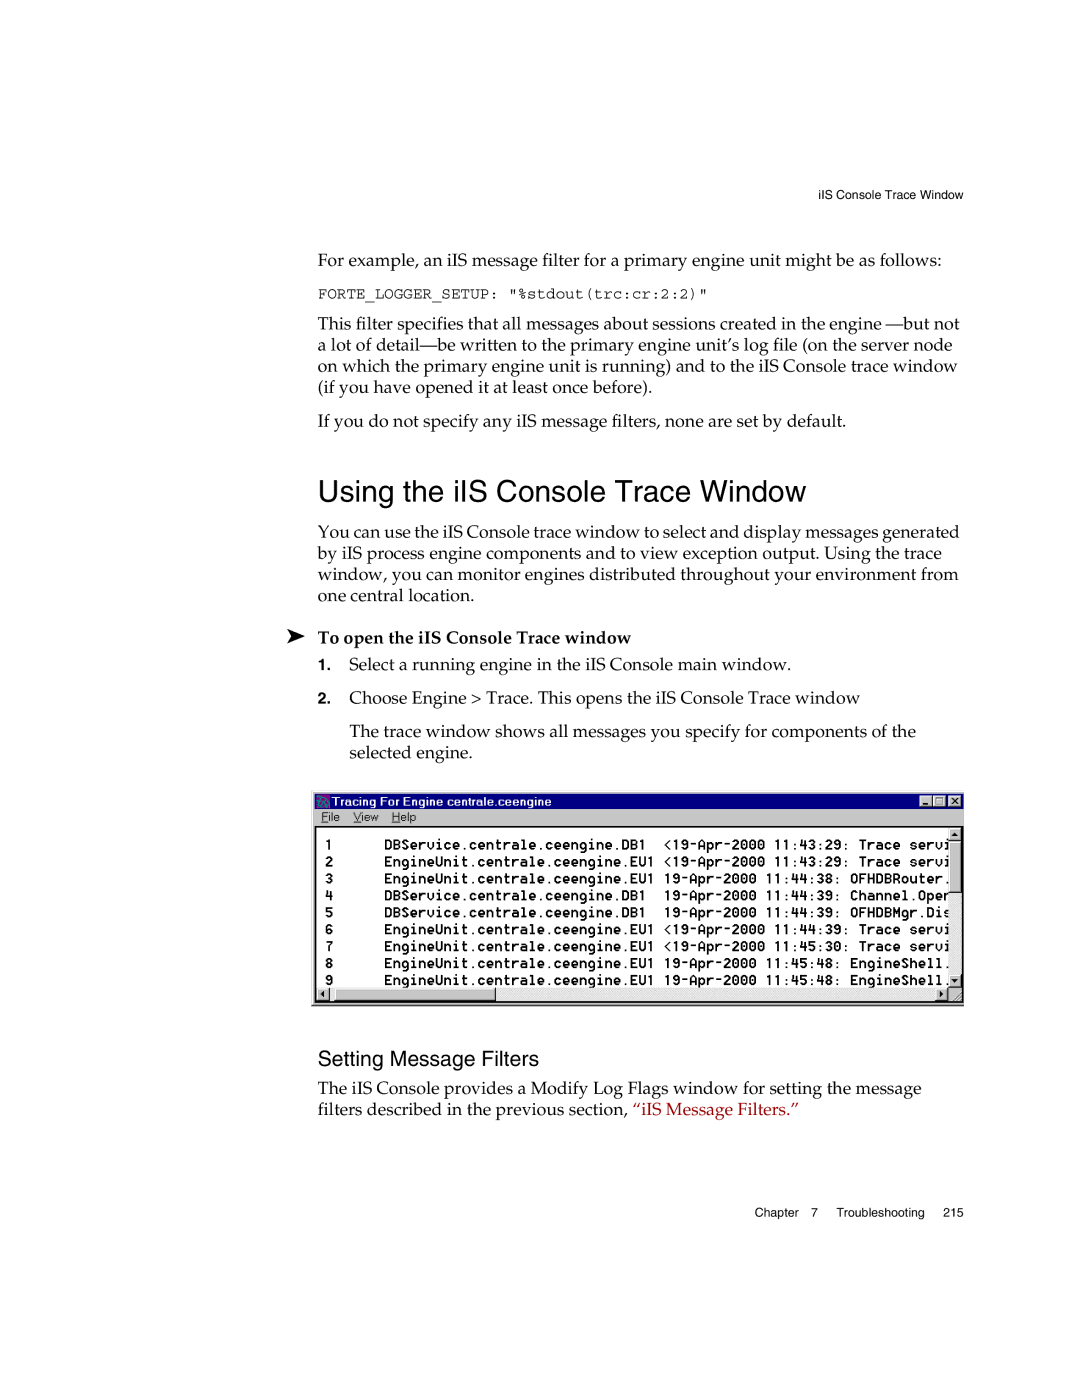
➤To open the iIS Console Trace window
1.Select a running engine in the iIS Console main window.
2.Choose Engine > Trace. This opens the iIS Console Trace window
The trace window shows all messages you specify for components of the selected engine.
Setting Message Filters
The iIS Console provides a Modify Log Flags window for setting the message filters described in the previous section, “iIS Message Filters.”
Chapter 7 Troubleshooting 215