Performance Charts
Filtering Engine Events
A fourth way to view engine events is by providing a custom filter. You can filter on events involving sessions, process instances, activities, engine objects, timers and registrations. For details on valid filter expressions, see “CreateFilter” on page 279.
➤To specify a custom filter
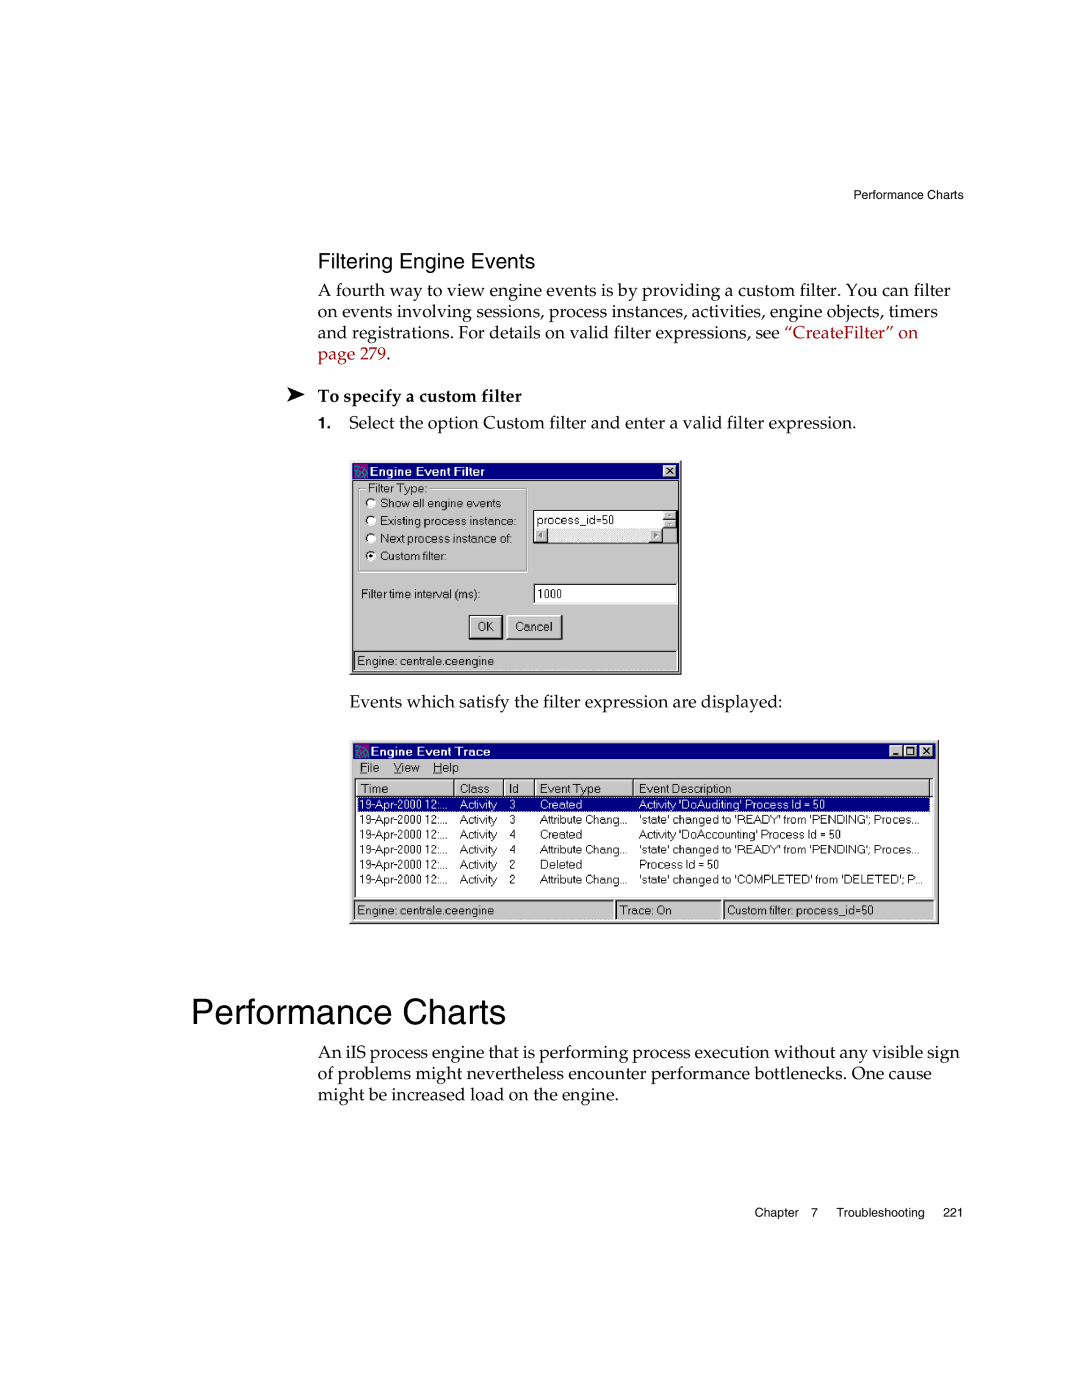
1. Select the option Custom filter and enter a valid filter expression.
Events which satisfy the filter expression are displayed:
Performance Charts
An iIS process engine that is performing process execution without any visible sign of problems might nevertheless encounter performance bottlenecks. One cause might be increased load on the engine.
Chapter 7 Troubleshooting 221