Cisco Support Tools User Guide for Cisco Unified Software
Page
Table of Contents
Part 3. Installing, Upgrading and Configuring Support Tools
Iii
Part 4. The Support Tools Dashboard
Page
Part 6. Using Cisco Common Tools 153
Page
Vii
193
Viii
Sqlew
Part 8. Reference 249
Page
List of Figures
Xii
Purpose
Preface
Audience
Related Documentation
Organization
Conventions
Cisco.com
Obtaining Documentation
Documentation Feedback
You can access international Cisco websites at this URL
Product Documentation DVD Ordering Documentation
Product Alerts and Field Notices
Reporting Security Problems in Cisco Products
Cisco Product Security Overview
Cisco Technical Support & Documentation Website
Obtaining Technical Assistance
Definitions of Service Request Severity
Submitting a Service Request
Obtaining Additional Publications and Information
Preface Obtaining Additional Publications and Information
Preface Obtaining Additional Publications and Information
Page
Page
Chapter
New Features in this Release
New Features in this Release
This section contains the following topics
Support Tools Node Requirements
Cisco Intelligent Contact Above All Management ICM and IP
Support Tools Node Hardware Requirements
Support Tools Server Requirements
Support Tools Node Software Requirements
Support Tools Server Hardware Requirements
Support Tools Port Requirements
Support Tools Server / Node Version Compatibility
Support Tools Server OS Requirements
Support Tools Server Network Requirements
Support Tools Listening Port
Support Tools Dashboard Web Browser Requirements
Part 2 Support Tools Overview
Page
About Cisco Support Tools
Key Features
About Support Tools Components
Key Features
Support Tools Server
About Support Tools Network Topology
Support Tools Node
What is the benefit of Support Tools?
Frequently Asked Questions
Who can use Support Tools?
About Cisco Support Tools Frequently Asked Questions
Support Tools Utilities List
About Support Tools Utilities
Trace and Log Tools
Web Tools
Cisco Common Tools
3rd Party Common Tools
Enable specific debug tracing in the call router
Viewing status, statistics, etc. It is also possible to
Use to view user-defined number of lines from
Use to view statistics for the local Workstation
Automatically restart the host after 60 seconds
Displays and configures event triggers on local
Privileged Utilities
Utility Installation Locations
Non-Dashboard Utilities
Command-Line vs GUI Access
About Support Tools Utilities Command-Line vs GUI Access
Working in Interactive Mode
Interactive Mode vs. Batch Mode
Working in Batch Mode
Canceling a Batch Mode Job
Using Tools in Batch Mode
Pending Jobs
Click Cancel
Interactive Mode vs. Batch Mode Pending Jobs
About Support Tools Security
Support Tools Security Features
Automated IPSec Implementation
Using IPSecurity with Support Tools
Manual IPSec Implementation
Page
Part 3 Installing, Upgrading and Configuring Support Tools
Page
About Installing Support Tools
Installing Support Tools
Support Tools Installation Tasks
Collect information for the install
How to Collect Information for Support Tools Installation
Post-Installation Configuration
How to Create Support Tools User Groups
To Create Support Tools User Groups
How to Create the Distinguished User Account
Creating Local Accounts on the Support Tools Server
How to Install the Support Tools Server
How to Create the Distinguished User Account
Page
Page
How to Install the Support Tools Node
Press Enter. The Support Tools Dashboard Login screen opens
How to Test the Support Tools Installation
Password field, enter your Windows password case-sensitive
Page
Page
About Configuring Support Tools
Configuring Support Tools
How to Modify Support Tools Basic Configuration
TCP/IP Port
How to Disable Continuous Virus Scan for the Repository
Supporttoolsroot\repository\system files\
Page
List/wmi.asp
Configuration of sysquery and Trace
How to Uninstall Support Tools
Uninstalling, Reinstalling and Upgrading Support Tools
Upgrading Support Tools
How to Reinstall Support Tools
Part 4 The Support Tools Dashboard
Page
Support Tools Dashboard
Using the Support Tools Dashboard
Using the Dashboard for the First Time
Accessing the Dashboard and Privileges
Accessing the Dashboard
Accessing Utilities in the Dashboard
Adding a System to the System List
Selecting a System to Work With in Interactive Mode
To access the Support Tools Dashboard
How to Access the Support Tools Dashboard
Navigating and Refreshing Pages in the Dashboard
To Add a Node to the System List
How to Use the System Management Screen
To Test the Connection to a Node
To Automatically Add CVP and Support Tools Server Nodes
To Delete a Node from the System List
Click the Add System Button
Using the Select System Screen
Using the Select System Screen
Adding a Support Tools Node to the System List
How to End a Dashboard Session
Page
Page
Part 5 Using Support Tools Web Tools
Page
How to Use the System Interrogate Screen
Using Support Tools Utilities from the Dashboard
Page
Interactive
Component & Sub-components
Mode
Odbc
Cisco ICM/IPCC Agent Reskilling
Component & Sub-components Retrievable Only Interactive Mode
Cisco Agent Desktop CAD
Cisco CallManager
Cisco Ipcc Express
Component & Sub-components
Cisco Support Tools
To Retrieve System Information in Interactive Mode
To Save System Information to a File
To Retrieve System Information in Batch Mode
To Save Files Returned from a System Interrogate
How to Use the History Screens
To View a Saved File
To Set an Expiration Date for History Files
To Rename a File
To Delete a File
How to Use the Registry Screen
To Download a File
To use the Registry Screen
How to Use the Registry Compare Screen
To Compare the Current System to a Saved Registry File
To Compare the Current System to Another
To Compare Two Saved Registry Files
Click the Compare Registries Files button
Understanding the Compare Registries Display
100
To Copy Key Values Between Registries and Files
Viewing Registry Keys for Multiple Customer Instances
101
102
To Save a Registry Comparison to a File
To View Processes
How to Use the Processes Screen
103
To Save a Process
How to Use the Services Screen
To Terminate a Process
104
To Stop or Start a Service
To View Services
105
Trace and Log
To Save the Services List to a File
106
To Create a Log Group
How to Use the Create Log Group Screen
107
108
Click Next
109
Viewing Log Groups
How to Use the Log Groups Screen
Editing Log Groups
Renaming Log Groups
Deleting Log Groups
How to Use the Create Trace Group Screen Batch Mode
Refreshing the Log Groups Screen
111
Creating a Trace Group
How to Use the Create Trace Group Screen Interactive Mode
112
Viewing a Trace Groups Settings
How to Use the Trace Groups Screen
113
Editing a Trace Group
Viewing a Trace Groups File
114
Deleting Trace Groups
Renaming Trace Groups
Refreshing the Trace Groups Screen
115
Scheduling a Trace
How to Use the Schedule Trace Screen
116
Products Supported for Log Collection
About Log Collection
Collect Logs General Steps
117
118
What are Merged Logs?
To Create a Log Collection
How to Use the Collect Logs Screen Batch Mode
119
120
How to Use the Log Collections Screen
To Download Collected Logs
To View Details of Log Collections
121
To Delete a Log Collection
Log File Naming Conventions
To Rename a Log Collection
Log files use the following naming conventions For ICM
123
How to Use the Collect Logs Screen Interactive Mode
124
125
Using Cisco Tools from a Command Line
Selecting a System to Use
Command-Line Mode vs Interactive Mode
Selecting a Different Application Server
126
Selecting a Different Target System
Getting Help for Command Line Tools
Viewing a list of targetable systems
Saving, Viewing, and Retrieving Files
To Access the Services Utility from a Command Line
How to Use the Services Utility from a Command Line
Embedded Spaces
128
Utility Displays syntax for a specified command
Using the Services Utility from a Command Line
Specified, the utility is run on the local system
Specified, the utility is run against the local system
Stop Stops a started service on the target system
Starting a service
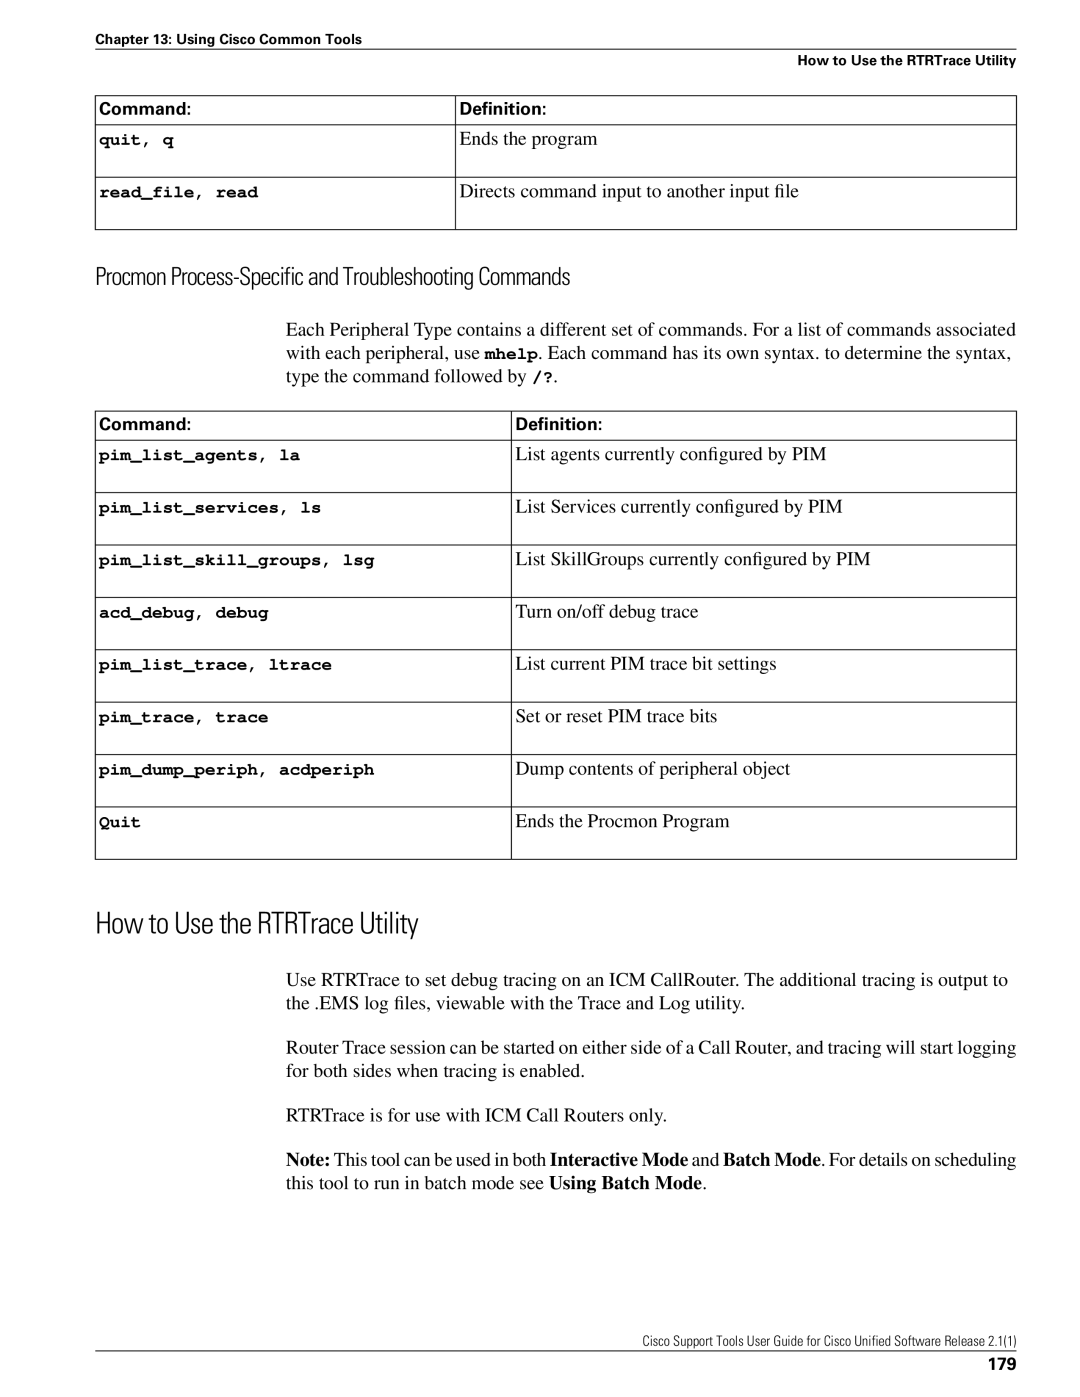
Readfile, read Directs command input to another input file
Quit, q Ends the program
Viewing and Stopping a Service Examples
How to Use the Processes Utility from a Command Line
To Run the Processes Utility from a Command Line
132
Using the Processes Utility from a Command Line
Kill Terminates a started process on the target system
Viewing and Killing a Service Examples
Server
133
Using the System Interrogate Utility from a Command Line
To Run the System Interrogate Utility from a Command Line
134
135
Repository on the application server
Viewing System Information Examples
How to Use the Registry Utility from a Command Line
Using the Registry Utility from a Command Line
To Run the Registry Utility from a Command Line
137
Instance whose registry values will be returned
Command Description
138
Invokes the Registry utility
Viewing Registry Information Examples
Named customer1
Timestamp.xml
Using the Compare Registries Utility from a Command Line
To Run the Compare Registries Utility from a Command Line
140
By SRC =
Compare, comp
141
142
Compare Registries Examples
Cases these may not be identical instances
How to Use the Log Groups Utility from a Command Line
Apply
143
Using the Log Groups Utility from a Command Line
To Run the Log Groups Utility from a Command Line
Enter lgtool
144
145
Rl logname Lsl Lgdesc description Closelg Lslg
Repository Renameloggroup, renlg
Creating a Log Group Examples
146
To Run the Log Collection Utility from a Command Line
How to Use the Log Collection Utility from a Command Line
Using the Log Collection Utility from a Command Line
Enter lctool
Lcdesc Seticmbinary, bin
Ccolreq Specifies the new collections name
Endtime
148
149
Downloadlog, download
As your application server
Log Collection Examples
150
151
152
153
Part 6 Using Cisco Common Tools
154
Call Routers but can X be run from any ICM component
Utility Description Name
Vrutrace Use to output tracing information from a Voice
155
156
How to Use the CICMan Utility
Using Cisco Common Tools
To Access CICMan from the Dashboard
157
Using CICMan Command line Options
To Access CICMan from a Command Line on a Node
158
To Access CTITest from the Dashboard
How to Use the CTITest Utility
159
Using CTITest Configuring
To Access CTITest from a Command Line on a Node
160
Using CTITest Logging
Using CTITest Opening a Session
161
Command Parameters
Below is list of frequently used commands in CTITest
162
To Access DBDiff from the Dashboard
How to Use the DBDiff Utility
Command
163
To Access DBDiff from a Command Line on a Node
How to Use the DumpCfg Utility
Using DBDiff
164
To Access DumpCfg from the Dashboard
How to Use the Icmdba Utility
To Access DumpCfg from a Command Line on a Node
Using DumpCfg
Accessing Icmdba
How to Use the MPTrace Utility
To Access MPTrace from the Dashboard
To run MPTrace from the Support Tools Dashboard
Using MPTrace Command Line Options
To Access MPTrace from a Command Line on a Node
167
To Access Nicroi from the Dashboard
How to Use the Nicroi Utility
To Access Nicroi from a Command Line on a Node
168
Capturing Nicroi Data to niclog.xxx
Using Tracing in Nicroi
169
Copying Nicroi Log Files
Capturing Nicroi Data to Roilog.txt
170
Setting the Download Directory
How to Use the NMStart Utility
To Access NMStart from the Dashboard
Transferring Files
To Access NMStart from a Command Line on a Node
How to Use the NMStop Utility
Using NMStart
To Access NMStop from the Dashboard
To Access NMStop from a Command Line on a Node
How to Use the OPCTest Utility
Using NMStop
To Access OPCTest from the Dashboard
Using OPCTest
To Access OPCTest from a Command Line on a Node
174
175
Debug Information
Example
176
To Access Procmon from the Dashboard
How to Use the Procmon Utility
Use the quit command to exit OPCTest
Exiting and Quitting OPCTest
Using Procmon
To Access Procmon from a Command Line on a Node
Procmon Basic Commands
Procmon Process-Specific and Troubleshooting Commands
How to Use the RTRTrace Utility
179
Accessing RTRTrace
How to Use the RTTest Utility
To Access RTTest from the Dashboard
180
Using RTTest
To Access RTTest from a Command Line on a Node
181
Process LastStateChange LastHeartBeat
Status Output Process
182
Transfer to the other side
Equipment use UTC time as a common time reference
Signifies that the process is running fine
Process synchronized
With the ICM call router
Status Output Controller
Date Current date Time Current local time
ICM peripheral gateway
Status Output Peripheral
Been established with the ICM peripheral gateway
Data are sent to the ICM peripheral gateway
186
Parameter Descriptions
187
188
Turning up ICM Call Router Tracing with RTTest
189
Turning Off Debug Tracing in RTTest
How to Use the VRUTrace Utility
How to Use the SS7NICTrace Utility
Accessing SS7NICTrace
To Access VRUTrace from the Dashboard
Using VRUTrace Command Line Options
To Access VRUTrace from a Command Line on a Node
VRUTrace Examples
191
192
Systems
Utility Name Description
193
194
195
Network Logman
Their properties Eventtriggers
196
TasklistCSV Displays a list of applications and services
Tasklist Displays a list of applications and services
Properties, such as RAM, disk space, Network cards Taskkill
197
198
Arp -a
Using 3rd Party Common Tools
Cat
Use the CAT utility to display, print, and combine files
Using CAT Command Line Options
To Access CAT from the Dashboard
200
Using Chmod Command Line Options
To Access Chmod from the Dashboard
Chmod
Use the Chmod utility to set file permissions
Using CP Command Line Options
To Access CP from the Dashboard
Use the CP utility to copy files
202
203
To Access DF from the Dashboard
To Access Diff from the Dashboard
Using DF Command Line Options
Diff
204
205
Using Diff Command Line Options
Using DU Command Line Options
To Access DU from the Dashboard
206
Using FGrep Command Line Options
To Access FGrep from the Dashboard
Fgrep
207
FindStr
To Access Findstr from the Dashboard
208
209
Using Findstr Command Line Options
Grep
To Access Grep from the Dashboard
210
211
Using Grep Command Line Options
Using Head Command Line Options
To Access Head from the Dashboard
Head
212
Count defaults to
IPConfig /all
213
214
To Access Isql from the Dashboard
Isql uses the following options
Using Isql
215
To Access LS from the Dashboard
Accessing ISQL/W
Use the LS utility to view directory listings
216
217
Using LS Command Line Options
Using MV Command Line Options
To Access MV from the Dashboard
218
NBTStat
To Access NBTStat from the Dashboard
219
Net Session
Using NBTStat Command Line Options
220
Net Statistics Server
To Access NetStat from the Dashboard
Net Statistics Workstation
NetStat
To Access NSLookup from the Dashboard
Using NetStat Command Line Options
NSLookUp
222
To Access PathPing from the Dashboard
Using NSLookup Command Line Options
Using PathPing Command Line Options
PathPing
Using Ping Command Line Options
To Access Ping from the Dashboard
Ping
Options for Ping are
225
PStat
Using RM Command Line Options
To Access RM from the Dashboard
Route -PRINT
226
Using Stopshut Command Line Options
To Access Stopshut from the Dashboard
Shutdown Tool
StopShut
To Access Strings from the Dashboard
Accessing Sqlew
Strings
228
To Access Tail from the Dashboard
Using Strings Command Line Options
Tail
229
To Access Touch from the Dashboard
Using Tail Command Line Options
Touch
230
231
Using Touch Command Line Options
Using Tracert Command Line Options
To Access Tracert from the Dashboard
To Access WC from the Dashboard
Tracert
To Access Which from the Dashboard
Using WC Command Line Options
Which
233
Winmsd
Using Which Command Line Options
234
Accessing WinMSD
Bootcfgqry
Displays the Boot.ini file settings of the selected system
NetshDump
Defragreport
To Access Eventtriggers from the Dashboard
Driverquery
Eventtriggers
To Access Logman from the Dashboard
Using Eventtriggers Command Line Options
Getmac
Logman
238
Logman Command Line options
239
Relog
Openfiles
240
Using Relog Command Line Options
To Access Relog from the Dashboard
241
242
Answer yes to all questions without prompting Examples
Schtasks
To Access Schtasks from the Dashboard
243
SysteminfoTable
Using Schtasks Command Line Options
244
SysteminfoCSV
SysteminfoList
Taskkill
245
Eq, ne
Eq, ne Service name
Eq, ne Image name
Eq, ne, gt, lt, ge, le PID value
Tasklist
TasklistTable
TasklistCSV
247
248
249
Part 8 Reference
250
251
Starting and Stopping Support Tools Server/Node Processes
How to Stop and Start the Support Tools Server
How to Enable/Disable the Stpa Process
How Stop and Start the Node Agent Service
252
253
254
How to View Support ToolsInstall Logs
How to View Support Tools Logs
How to View Support Tools Server and Stna Log Files
How to View Stpa Log Files
256
How to Examine Your IPSec Policy
IPSec Settings and Procedures
Select the IP Security Policy Management snap-in
257
How to Enable/Disable the IPSec Policy
How to Verif the PreShared Key
258
259
260
261
How to Modify the Login Screen Disclaimer
262
263
How to Confirm the Support Tools Build Number
264
Installation Problems
Support Tools Troubleshooting
Install Hangs
Support Tools Fails to Install
Support Tools Installs Disabled
Dashboard Troubleshooting
Connection Problems
Services are not created and/or do not start
Can Access Dashboard Login Page but cannot log
Login Problems
Incorrect or invalid username or password entered
Re-enter username and password as follows Network Users
Error When Selecting Host
Utility Problems
Support Tools Server fails to connect to the Node Agent
Local Users
Utilities Missing
Error Processing Request
269
Error Processing Request
Dashboard Problems
Dashboard Will Not Load
Dashboard Online Help Does Not Display
Popup blockers enabled on client machine
Dashboard online help does not display when selected
Disable popup blocking
271
272
Index
Index