LaserSpeed 8000-3 Instruction Handbook
LaserTrak Software
Displaying Data
There are three main ways to display data. They are the Chart Recorder, Length and Speed Monitor and the Length Histogram. To select a the type of data display click File, then position the cursor over New on the drop down menu to bring up the selection tab with the three choices. Select Chart, Monitor or Length Mode by clicking on the drop down selection menu.
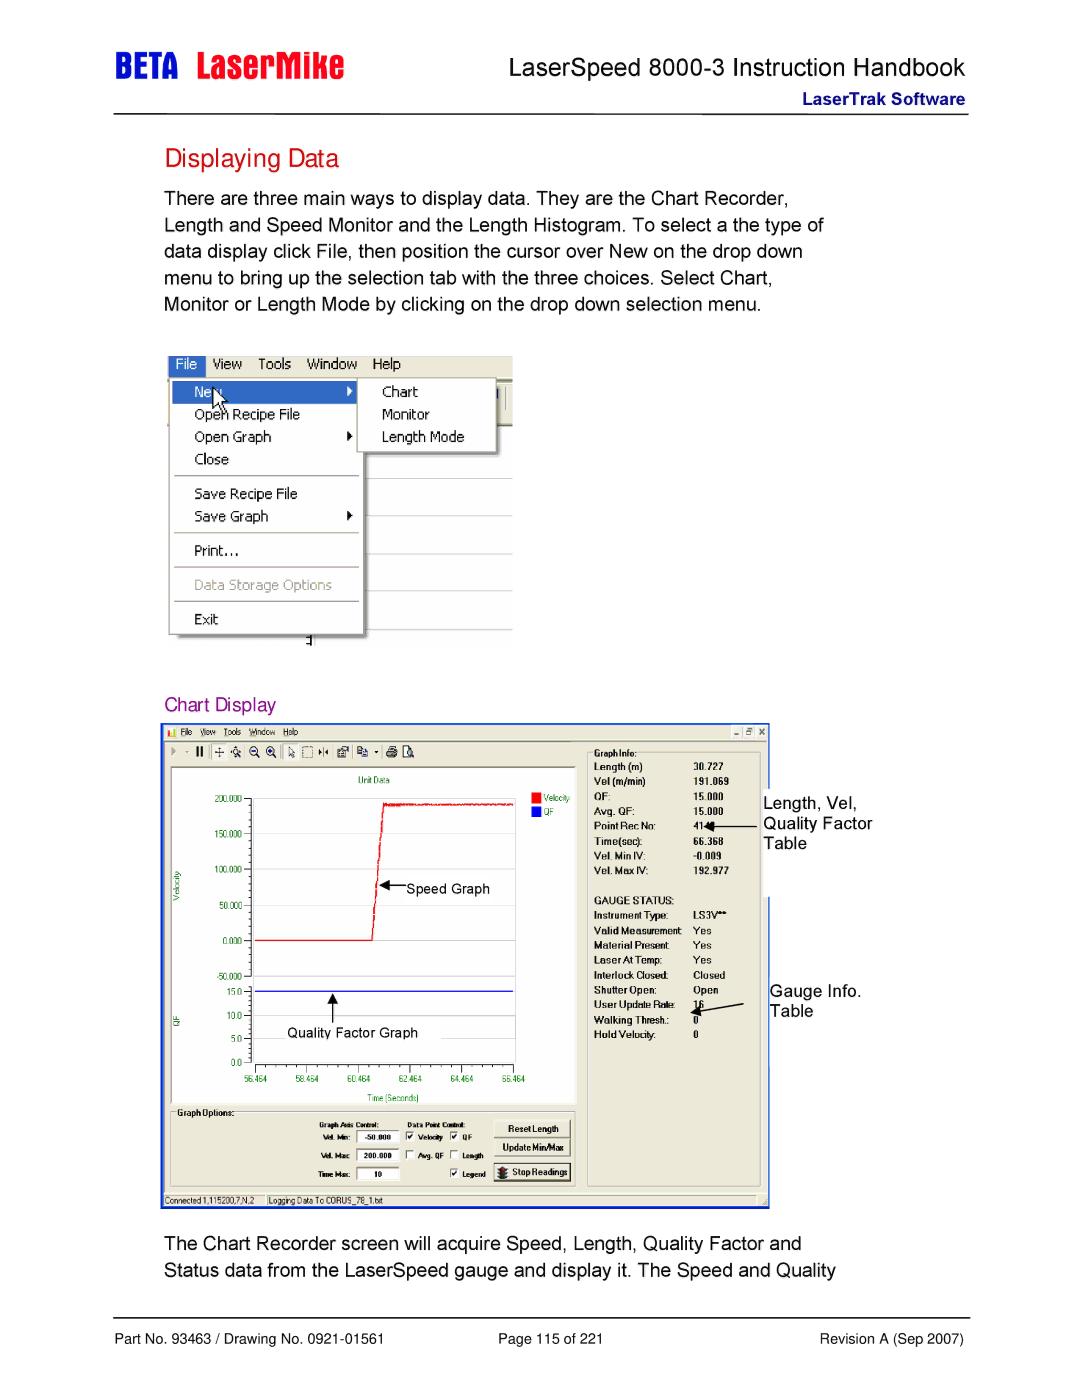
Chart Display
Length, Vel,
Quality Factor
Table
![]() Speed Graph
Speed Graph
Gauge Info.
Table
Quality Factor Graph
The Chart Recorder screen will acquire Speed, Length, Quality Factor and Status data from the LaserSpeed gauge and display it. The Speed and Quality
Part No. 93463 / Drawing No. | Page 115 of 221 | Revision A (Sep 2007) |