Viewing Mstat Summary Page
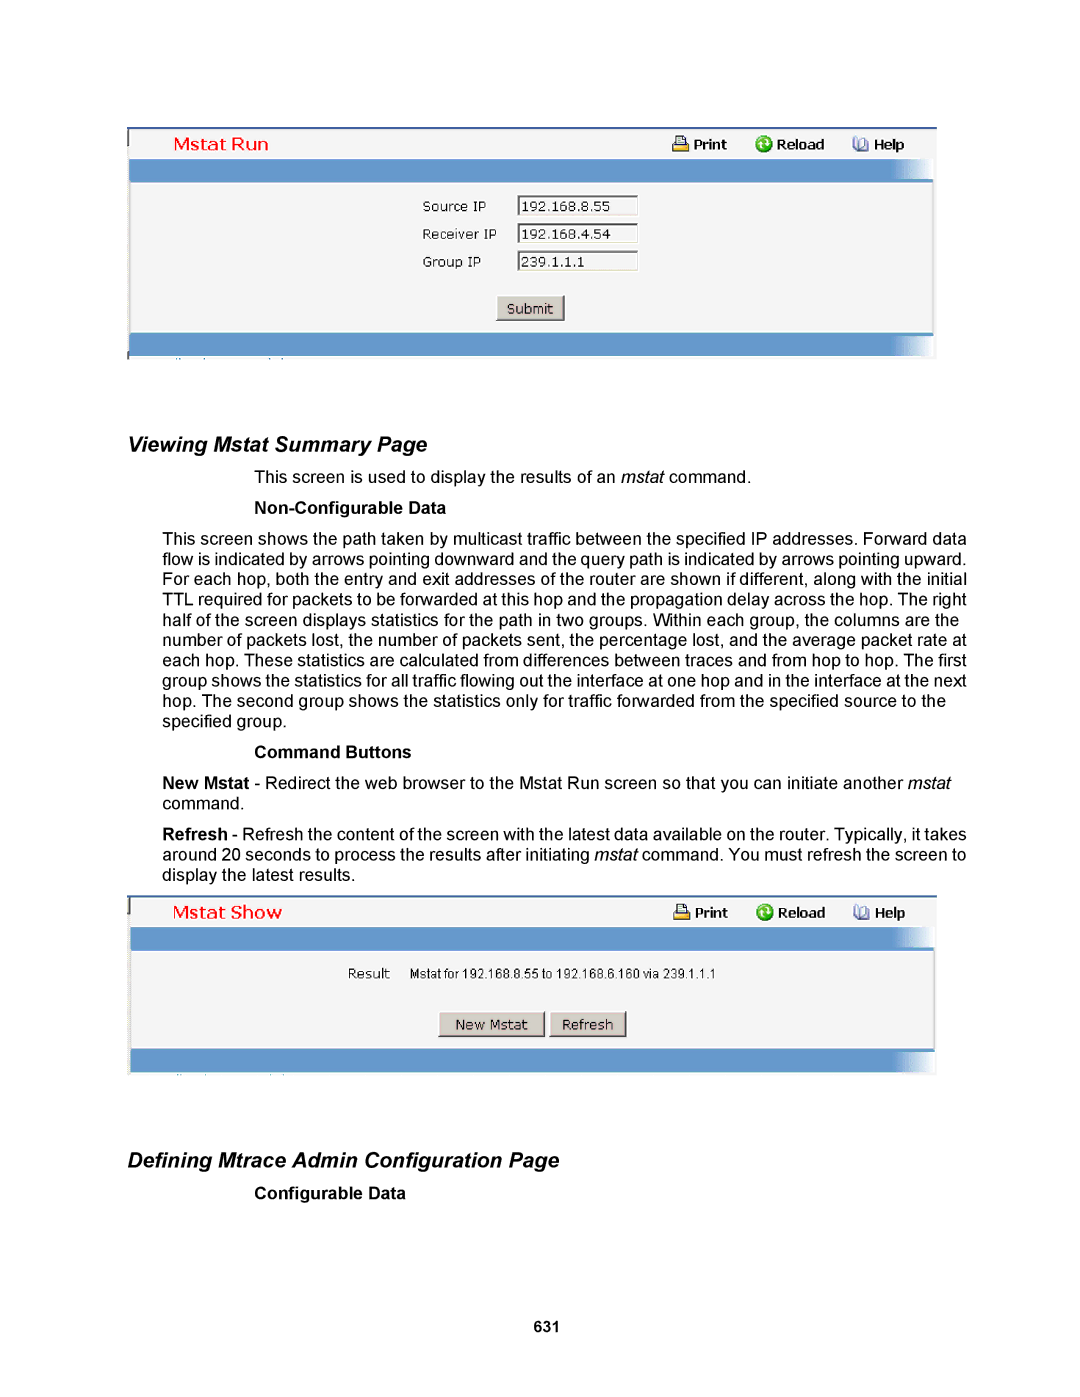
This screen is used to display the results of an mstat command.
Non-Configurable Data
This screen shows the path taken by multicast traffic between the specified IP addresses. Forward data flow is indicated by arrows pointing downward and the query path is indicated by arrows pointing upward. For each hop, both the entry and exit addresses of the router are shown if different, along with the initial TTL required for packets to be forwarded at this hop and the propagation delay across the hop. The right half of the screen displays statistics for the path in two groups. Within each group, the columns are the number of packets lost, the number of packets sent, the percentage lost, and the average packet rate at each hop. These statistics are calculated from differences between traces and from hop to hop. The first group shows the statistics for all traffic flowing out the interface at one hop and in the interface at the next hop. The second group shows the statistics only for traffic forwarded from the specified source to the specified group.
Command Buttons
New Mstat - Redirect the web browser to the Mstat Run screen so that you can initiate another mstat command.
Refresh - Refresh the content of the screen with the latest data available on the router. Typically, it takes around 20 seconds to process the results after initiating mstat command. You must refresh the screen to display the latest results.
Defining Mtrace Admin Configuration Page
Configurable Data
631
