HP Rut No -90367 Supersedes October Printed iu USA February
User’s Guide
@ Copyright Hewlett-Packard Company 1998
Wmanty
Certification
Shipment for Service
Maintenance
Clean the cabinet, using a damp cloth only
Assistance
JspaJp Fb@me
‘Iktble O-1. Hewlett-Packard Sales and Service OfEces
Instrument Markings
Safety Symbols
General Safety Considerations
Compliance with German Noise Requirements
Compliance with German FTZ Emissions Requirements
Acoustic Noise Emission/Geraeuschemission
LpA70 dB Lpa70 dD
User’s Guide Overview
Network Analyzer Documentation Set
Page
Declaration of Conformity
Contents
Page
Making Mixer Measurements
Printing, Plotting, and Saving Measurement Results
LO to RF Isolation RF Feedthrough
Optimizing
Application and Operation Concepts
Uncoupling StimuIus Values Between Primary Channels
Contents-ll
C0ti0ntr-8
TRL Calibration Procedure Requirements for TRL Standards
TRL* Error Model Isolation Source match and load match
Calibrated Power Level
Loss of Power Meter Calibration Data
Locking onto a signal with a frequency modulation component
Transforming CW Time Measurements Into the Frequency Domain
Specifications and Measurement Uncertainties
Menu Maps Key Definitions
Error Messages
Compatible Peripherals
11-l 11-2 11-3 11-4 11-5 11-6 11-7 11-8 11-9
CITIfUe Data Format and Keyword Reference
Preset State and Memory Allocation
Index
Determining System Measurement Uncertainties
Results
Example of Searching for a Bandwidth Using Markers
Display
Time Domain Transmission Example Measurement
Measurement Setup Diagram Shown on Analyzer Display
Gate Shape
Measurement
Contents-19
Combined Effects of Amplitude and Phase Modulation
Range Resolution of a Siie Discontinuity
Reflection Measurement of Two Cables 128
Response 134
Modulation
Diagram of Gain Compression
Range of a Forward Transform Measurement
Amplifier Parameters
Bles
Power-on Conditions versus Preset 12-11
Sufhx Character Definitions 12-5 Preset Conditions 1 12-8
Results of Power Loss to Non-Volatile Memory 12-12
12-3
HP 87533 Description and Options
Where to Look for More Information
Performance
Analyzer Description
Control
Printin& Plotting, and Saving
Accuracy
Disk eject button
Front Panel Features
HP 5753E Dessription and Options l-5
HP-IB Status indicators are also included in this block
Analyzer Display Single Channel, Cartesian Format
Analyzer Display
Application and Operation Concepts
From inactive channels
See J%I@ in , Key Definitions
10 HP 8753E Description and Options
%.n. This fan provides forced-air cooling for the analyzer
Rear Panel Features and Connectors
Fail ITLlow
Pass TTLhigh
Analyzer Options Available
Option lCP, Rack Mount Flange Kit With Handles
Service and Support Options
Lhble l-l. Comparing the J3P 8753AIBKYD
Differences among the HP 8753 Network Analyzers
‘able 1-2. Comparing the HP 8753D and HP 8753E
Making Measurements
‘lhble 2-l. Connector Care Quick Reference
Principles of Microwave Connector Care
Basic Measurement Sequence and Example
Setting the Frequency Range
Basic Measurement Sequence
Basic Measurement Example
Lb change the power level to -5 dRm, press
Setting the Source Power
Setting the Measurement
‘lb set the span to 30 MHz, press &gziJm
Measure the device under test
Example Dua.l Channel With Split Display On
Using the Display Functions
I............s..........i
To Save a Data Trace to the Display Memory
Lb View the Measurement Data and Memory Trace
Analyzer performs a vector subtraction on the complex data
To Divide Measurement Data by the Memory Trace
‘RI Ratio Measurements in Channel 1
Example of a Display Title
To Title the Active Channel Display
Page
Channel Display
To Activate and Co&lgure the Auxilkry Channels
Characterizing a Duplexer
Smith chart by pressing @GZ $#$Z~B&KX
Duplexer’s three ports are
Transmit TX
Required Equipment
Procedure for Characterizing a Duplexer
Press=
Port an unlit LED indicates no connection
D. F%ess @G-T to activate channel 4, press $%$.‘
Duplexer Measurement
To Use Continuous and Discrete Markers
Using Analyzer Display Markers
Or ~~~~~7
‘Ib switch off all of the markers, press ~~~
To Activate Display Markers
PRnl
Tb Move Marker Information off of the Grids
Press jj ~~~~~~~~ ‘~~~~, to m&e marker 1 a reference maker
Rlllllllllll
Lb Use Delta a Markers
‘Ib change the reference marker to marker 2, press
Lb Activate a Fixed Marker
Log Fiag 10 dfl, REF -50 d6 16 415 dB
Or enter a value from the front panel keypad
To move the reference position, press
‘lb Couple and Uncouple Display Markers
To access the polar markers, press
To Use Polar Format Markers
For the display channels
Sin 0, where M=magnitude
To Use Smith Chart Markers
~~~~~~~ ~~~~~~
‘j3JU
17. Example of Impedance Smith Chart Markers
‘lb Set Measurement Parameters Using Markers
Setting the Start Frequency
Setting the Center Frequency
Fl i t-11I
Value. .... ... y
22. Example of Setting the Reference Value Using a Marker
23. Example of Setting the Electrical Delay Using a Marker
Setting the CW Frequency
Searching for the Maximum Amplitude
‘lb Search for a Specific Amplitude
Searching for the Minimum Amplitude
~~~~~ ad
Example of Searching for a Beget Amplitude Using a Marker
Searching for a ‘beget Amplitude
Bandpass or band reject shape on the measurement trace
Press ~~~~~~ MarkerFctn‘~~~~~~~
Figure Z-28. Example Statistics of Measurement Data
To Calculate the Statistics of the Measurement Data
Connect your test device as shown in Figure
Measuring Magnitude and Insertion Phase Response
Measuring the Magnitude Response
30. Example Magnitude Response Measurement Results
Measuring Insertion Phase Response
32. Phase Samples
Phase Distortion
Measuring Electrical Length and Phase Distortion
Measuring Electrical Length
Electrical Length
34. Linearly changing Phase
Deviation From Linear Phase
Measuring Phase Distortion
36. Deviation From Linear Phase Example Measurement
Group Delay
37. Group Delay Example Measurement
III 11 I 11 11 MHZ
Lksting a Device with Limit Lines
Setting Up the Measurement Parameters
Creating Flat Limit Lines
41. Example Flat Limit Line
42. Example Flat Limit Lines
Creating a Sloping Limit Line
~~@#g
~9~~~~~~
Creating Single Point Limits
This example procedure, the following limits are set
Deleting Limit Segments
Editing Limit Segments
Activating the Limit Test
Bnnning a Limit Tkst
Reviewing the Limit Line Segments
Making Measurements
Offsetting Limit Lines
Lb produce a normalized trace, perform the following steps
Measuring Gain Compression
Lb place the marker eax.ct& on a measurement point, press
@ @ to change the scale to 1 dB per division
~~~~~~~~~~~ ~~~~~~~
Enter the start and stop power levels for the sweep
Press LMenu ~~~~~~~~~~ gaw,, $
~~~ ~~~ Mif Rress cmJ j-1 ~~~~~~~~~.~~~ ~~~..~~~~,~~~
48. Gain Compression Using Power Sweep
Press *F p#~~~.p~~~~6~~~~’
Measuring Gain and Reverse Isolation Simultaneously
Tiess c~isplay ~~~~,~~~~~~~~~~ ~~~~~~~~~~
To channel 1 and channel
49. Gain and Reverse Isolation
Set the following measurement parameters
Measurements Using the Swept List Mode
Connect the Device Under Test
Choose the Measurement Parameters
Observe the Characteristics of the Filter
To set up the swept list measurement, press
Gp&g ~~~
~~~~~~~~~ l-loJ Ixl
~~~~~~~~~~ m Lxl
Press iJk&~ ~~~~~~~~~~~~~h
Calibrate and Measure
KG&’
53. Filter Measurement Using Swept List Mode
Tuned receiver mode in-depth description
Measurements Using the Tuned Receiver Mode
Typical test setup
External Source Requirements
Tkst Sequencing
55. ‘l&t Sequencing Help Instructions
Creating a Sequence
Stopping a Sequence
Running a Sequence
Editing a Sequence
Inserting a Command
‘Ib delete the selected command, press =J backspace key
Clearing a Sequence from Memory
Modifying a Command
Changing the Sequence Title
Naming Files Generated by a Sequence
You stop at each character
Lb complete the titling, press %@@
Storing a Sequence on a Disk
Loading a Sequence from Disk
Procedure and then follow the printing sequence
Purging a Sequence from Disk
Printing a Sequence
To run both sequences, press
Cascading Multiple Example Sequences
Start of Sequence Trans FWD s21 B/R
Loop Counter Example Sequence
MKR Fctn
To run the loop sequence, press
Generating Files in a Loop Counter Example Sequence
Data file names generated by this sequence will be
Limit Test Example Sequence
Plot llle names generated by this sequence will be
‘lb nm the sequence, press
Recall FlEG
This will create a displayed list for sequence 1, as shown
Set the start frequency to a value greater than 16 MHz
Measuring Swept Harmonics Option 002 Only
Fundamental frequencies
57 nd Harmonic Power Level in dBc
Transmission Response in Time Domain
Measuring a Device in the Time Domain Option 010 Only
Gating
Connect the device as shown in Figure
59. Time Domain Transmission Example Measurement
Gating in a Time Domain Transmission Example Measurement
Fiiure 2-61. Gate Shape
‘able 2-2. Gate Characteristics
Gating Effects in a Frequency Domain Example Measurement
Reflection Response in Time Domain
64. Device Response in the Frequency Domain
65. Device Response in the Time Domain
Front panel keypad after each key press
Non-coaxial Measurements
Making Mixer Measurements
Where to Look for More Information
Measurement Considerations
Eliminating Unwanted Mixing and Leakage Signals
Minimizing Source and Load Mismatches
Reducing the Effect of Spurious Responses
Down Converter Port Connections
Jfqyw
Frequency Offset Mode Operation
Differences Between Internal and External R Channel Inputs
B Channel External Connection
Power Meter Calibration
Conversion Loss Using the Frequency Offset Mode
Page
Network Analyzer Power Meter POW-N&OR
To view the measurement trace, press
~~/...~ . . . . T.,, .. L? Jal~.i
Conversion Loss Example Measurement
High Dynamic Range Swept RF/IF Conversion Loss
10. Connections for Broad Band Power Meter Calibration
11. Connections for Eeceiver Calibration
Filter External LO Source
13. Example of Swept if Conversion Loss Measurement
Fixed if Mixer Measurements
Tuned Receiver Mode
Sequence 1 Setup
~~~~~,~~
Press the following keys on the analyzer to create sequence
Im ~~~~
~ .~~~~~~~~~~~
Done List Freq B
CaUing the Next Measurement Sequence
Sequence 2 Setup
Measurement Completed
Following sequence commands
16. Example Fixed if Mixer Measurement
Phase or Group Delay Measurements
17. Counections for a Group Delay Measurement
Scale the data for best vertical resolution
To make a response error-correction, press
Amplitude and Phase Tracking
Conversion Compression Using the Frequency Offset Mode
Make the connections as shown in Figure
Pg634e
Mixer Under Test External LO Source
~~~~~~ ~~~~~~~~~,~~
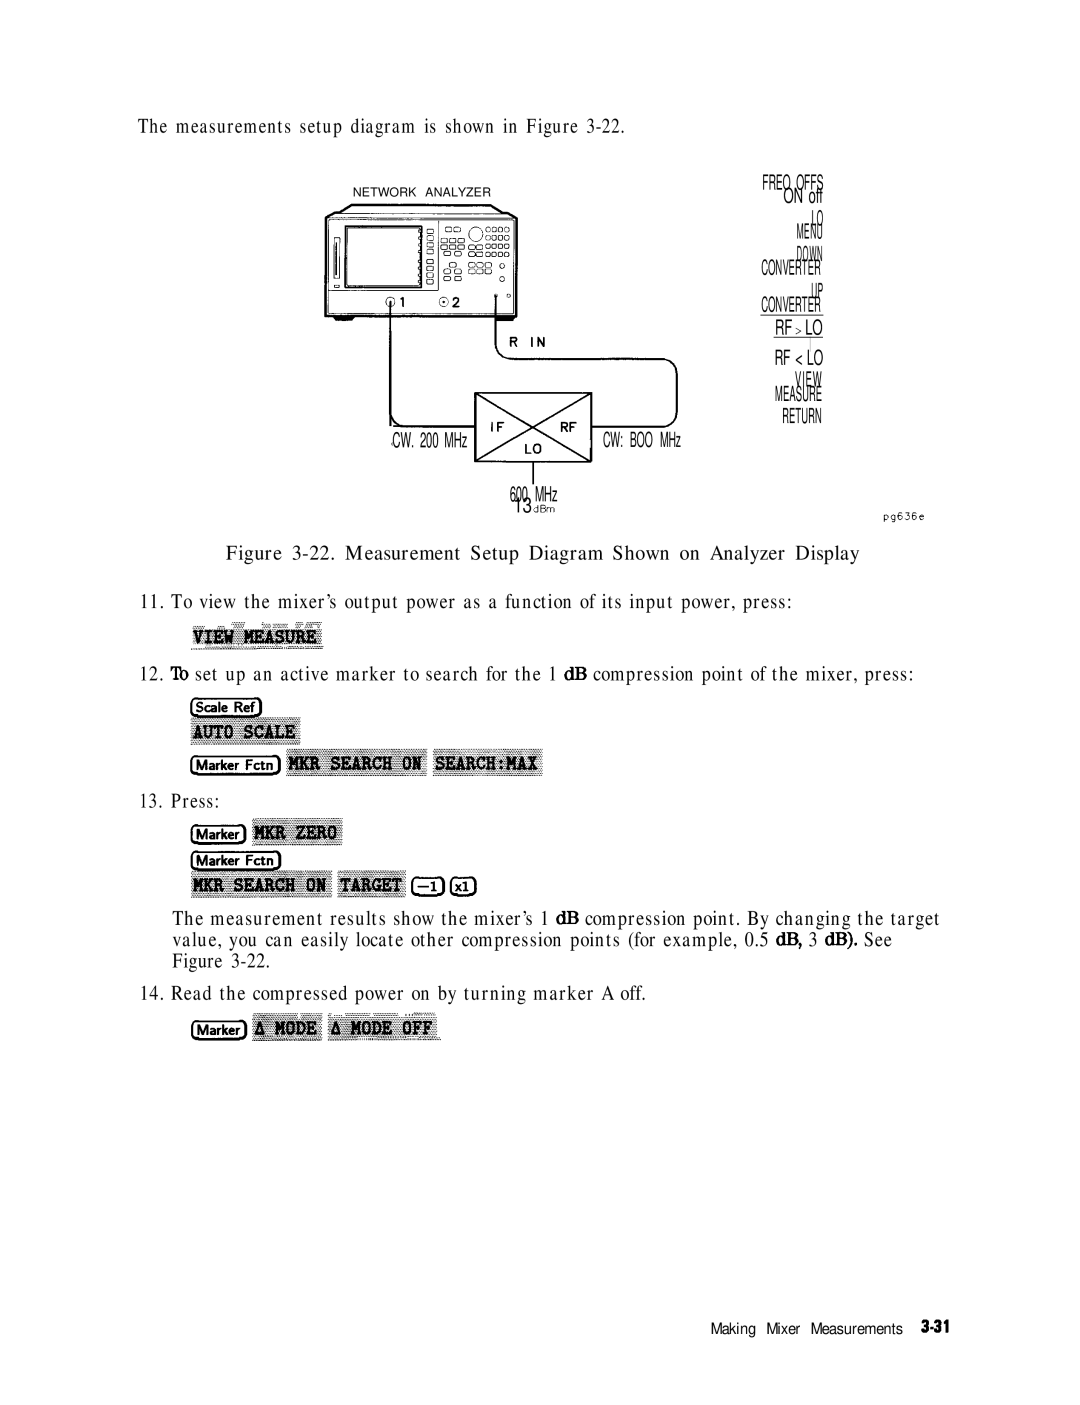
Measurements setup diagram is shown in Figure
Example Swept Power Conversion Compression Measurement
LO to RF Isolation
Isolation Example Measurements
26. Connections for a Mixer Isolation Measurement
Refer to , Optinking Measurement Results
27. Example Mixer ID to RF Isolation Measurement
RF Feedthrough
28. Connections for a Response Calibration
30. Example Mixer RF Feedthrough Measurement
Printing, Plotting, and Saving Measurement Results
Printinfl, Plotting, and Saving Measurement Results
Conf@uring a Print Function
Printing or Plotting Your Measurement Results
~.~.~.~.~.~..~.~ ....ii.........i..~~~
Black and white from a color printer
Defining a Print Function
Printing One Measurement Per
If Yim Are Using a Color Printer
To Reset the Printing Parameters to Default Values
Printing Multiple Measurements Per
I i i
Page
~............../i
Plot function as follows ~,~,~
If Yim Are Plotting to a Pen Plotter Then @ii. &g. Mti
S K E J E C T T T O N L
If You Are Plotting to a Disk Drive
Selecting Auto-Feed
Defining a Plot Function
Choosing Display Elements
Corresponding Key
Selecting Pen Numbers and Colors
Channel
Selecting Line Types
Press ~&&&&& mtd the selection appears that you want
Choosing Scale
To Reset the Plotting Parameters to Default Values
Plotting One Measurement Per Page Using a Pen Plotter
Plot Quadrants
Plotting Multiple Measurements Per Page Using a Pen Plotter
8 Printing, Plotting, and Saving Measurement Results
Automatic File Naming Convention for LIF Format
Plotting a Measurement to Disk
To Output the Plot Files
To View Plot Files on a PC
Using AmiPro
Outputting Plot Files from a PC to a Plotter
Using Freelance
Store the Hpgl initialization sequence
Store the exit Hpgl mode and form feed sequence
Outputting Single Page Plots Using a Printer
PLOTOO.RL PLUTOO.RU
Outputting Multiple Plots to a Single Page Using a Printer
‘lb Plot Multiple Measurements on a Full
Plotting Multiple Measurements Per Page From Disk
PL0TOOFPD
11. Plot Quadrants
To Plot Measurements in Page Quadrants
Titling the Displayed Measurement
If Ibu Want a Single Page of Values
Confqjuring the Analyzer to Produce a Time Stamp
Aborting a Print or Plot Process
If You Want the Entire List of Values
Solving Problems with Printing or Plotting
Saving and Recalling Instrument States
Places Where Ybu Can Save
What You Can Save to the Analyzer’s Internal Memory
What You Can Save to a Floppy Disk
What You Can Save to a Computer
Saving an Instrument State
Peripheral Access
Deline Save ModificationFlexibility II Dnring
Saving Measurement Results
Ad enter the &-ive where your &Sk is located
See Ascii Data Formats. ’
S2P Data Format
Ascii Data Formats
Template for component data fiIes is as follows Comment line
‘lb Delete an Instrument State File
Re-Saving an Instrument State
~~~~.~~~~~
Renaming a File
Formatting a Disk
Solving Problems with Saving or Recalling Files
If Yim Are Using an External Disk Drive
Optimizing Measurement Results
Interconnecting Cables
Connector Repeatability
Temperature Drift
Increasing Measurement Accuracy
Reference Plane and Port Extensions
Frequency Drift
Performance Verification
Types of Error-Correction
Measurement Error-Correction
Conditions Where Error-Correction is Suggested
Error-Correction Stimulus State
Calibration Standards
When to Use Interpolated Error-Correction
~~~~~~~~~~
Procedures for Error-Correcting Your Measurements
Response Error-Correction for Reflection Measurements
Frequency Response Error-Corrections
Network Analyzer
2J. $!B
Response Error-Correction for Transmission Measurements
Standard Connections for Receiver Calibration
Receiver Calibration
Results chapter for procedures
Frequency Response and Isolation Error-Corrections
Pg612e
Optimizing Measurement Results
Ad enter at leaf, four times more
Connect your device under test
One-Port Reflection Error-Correction
Open Short Loag Open Short Load For S
Optimizing Measurement Results
For Reflection For Transmission For Isolation
Full Two-Port Error-Correction
To pORT 2, ad use the ~~~~~~~~~., ~~~~~~~~~~
Page
TRL Error-Correction
T&M* Error-Correction
TRMError-Correction
Come& the lOad to Port 2 a& press ~~~~~.,~~~~~
Page
~~~~~ Or ~~~~
Modifying !L’RL Standards
@ Lxl ~~~~~~~~~~~
Modifying TRM Standards
Assign the Stadards to the Various TRM Classes
Iabel the Classes
Page
Press ~,~~ and enter the segment number followed by xl
Entering the Power Sensor Calibration Data
Editing Frequency Segments
Deleting Frequency Segments
Compensating for Directional Coupler Response
Sample-and-Sweep Mode for Power Meter Calibration
Using Sample-and-Sweep Correction Mode
KGE
Using Continuous Correction Mode
To Calibrate the Analyzer Receiver to Measure Absolute Power
10. Noninsertable Device
Calibrating for Noninsertable Devices
11. Adapters Needed
Adapter Removal
12. ‘lko-Port Cal Set
Remove the Adapter
14. Cklibrated Measurement Verify the Results
Example Program
NON-INSERTABLE Dewce
MAtched Adapters
Modify the Cal Kit Thru Deilnition
Making Accurate Measurements of Electrically Long Devices
Cause of Measurement Problems
To Improve Measurement Results
Decreasing the Sweep Rate
Decreasing the Time Delay
Increasing Sweep Speed
To Use Swept List Mode
Detecting if Delay
Ib Decrease the Frequency Span
Lb Set the Auto Sweep Time Mode
Option
Option 006
‘Ib Reduce the Number of Measurement Points
Lb Widen the System Bandwidth
‘lb Reduce the Averaging Fktor
Lb View a Single Measurement Channel
Lb Set the Sweep Type
Select the sweep type
Points are of interest
To Use External Calibration
To Activate Chop Sweep Mode
‘lb Use Fast a-Port Calibration
Lb activate the continuous mode, press
‘lb enter the number of sweeps, press
Increasing Dynamic Range
To Increase the Test Port Input Power
To Reduce the Receiver Noise Floor
Changing System Bandwidth
Reducing Receiver Crosstalk
Reducing Trace Noise
To Activate Averaging
To Change System Bandwidth
~~~~~~~~~ ~~~~~~~~~.. f#jy %&ig ~~$fj& , /.. P
Reducing Recall Time
Understanding Spur Avoidance
Application and Operation Concepts
Where to Look for More Information
Built-In Synthesized Source
Signal-separation devices Receiver Display
HP 8753E System Operation
Receiver Block
Built-In ‘I&t Set
Microprocessor
Required Peripheral Equipment
Data Processing
Data Processing Flow Diagram
Processing Details
~...... .A....u.........s....i
Pre-Raw Data Arrays
Transform Option 010 Only
Channel 3 without pressing chanj twice
Active Channel Keys
Auxiliary Channels and Two-Port Calibration
Enabling Auxiliary Channels
Entry Block Keys
Multiple Channel Displays
Uncoupling Stimulus Values Between Primary Channels
Step Keys
Units Terminator
Knob
Modifyiug or Deleting Entries
Defining Ranges with Stimulus Keys
Stimulus Functions
Stimulus Menu
Understanding the Power Ranges
Power Menu
Power Range Transitions in the Automatic Mode
Test port collpling
Power Coupling Options
Channel coupling
Auto Sweep Time Mode
Manual Sweep Time Mode
Sweep Time
Minimum Sweep Time
‘12l.ble 6-1. Minimum Cycle Time in seconds
Trigger Menu
Continuously and the trace is updated with each sweep
Allowing Repetitive Switching of the Attenuator
Source Attenuator Switch Protection
Feature
Specified number of sweeps is completed.
Channel Stimulus Coupling ‘. . . . . . . .,‘....’
Sweep Type Menu
Stepped List Frequency Sweep Hz
Logarithmic Frequency Sweep Hz
Segment Menu
Loss of calibration
Parameters can also be saved with an instrument state
Stepped Edit Subsweep Menu
Power
Ii ,.,,,, ....i,..... ...c .i i
CW Time Sweep Seconds
Power Sweep dBm
Selecting Sweep Modes
Calibration section
Response Functions
Auxihary channel is enabled
Understanding S-Parameters
Parameters
Deilnition
S-parameter menu contains the following softkeys
Conversions, as these formats are not easily interpreted
Are available by means of which softkeys / .‘~ ~~~.,..~~~
Format Menu
Log Magnitude Format ~......, .~
Group Delay Format
Phase Format
13. Group Delay Format
Smith Chart Format
Polar Format
14. Standard and Inverse Smith Chart Formats
SWR Format
Linear Magnitude Format
Ima@naryFormat
Real Format
19. Constant Group Delay
Group Delay Principles
21. Rate of Phase Change Versus Frequency
Application and Operation Concepts
Scale Reference Menu
Electrical Delay
Or ~~~~~~~~~~
Assuming a relative permeability
Display Menu
Single graticule see -23a
Dual Channel Mode
4 Application and Operation Concepts
Customizing the Display
Four-Parameter Display Functions
Chapter for more information on this condition
Ble
Is sele&ed ~~~~6~~~~~ @ves you two choices for a
Provides a quick way to set up a four-parameter display
PRRI=IMETER Shortcut Keys
Yellow, indicating that the keys in yellow apply to channel
Two trace math operations are implemented
Setting Display Intensity
Memory Math F’unctions
\/ii
Setting Default Colors
Red 100
Numeric keypad, until the desired color appears
Yellow 100
Green 100
Following softkeys are located within the averaging menu
Averaging Menu
Averaging
If Bandwidth Reduction
Smoothing
27. if Bandwidth Reduction
28. Bbkers on Trace
Markers
Marker type
IMarker Menu
Is displayed
Marker Function Menu
Measurement Calibration
What Is Accuracy Enhancement?
Directivity
What Causes Measurement Errors?
Source Match
Frequency Response Tracking
Isolation crosstalk
One-Port Error Model
Characterizing Microwave Systematic Errors
34. Effective Directivity EDF
36. Reflection Tracking Em
38. Measured Effective Directivity
40. Open Circuit ?Lkrmina.tion
Device Measurement
+ !T + I Reverse S,2M
42. Bhjor Sources of Error
44. Load Match Em
45. Isolation Em
46. Full Two-Port Error Model
47. Full Two-Port Emor Model Equations
Measurement Parameters
Calibration Considerations
Device Measurements
Omitting Isolation Calibration
Frequency Response of Calibration Standards
Calibration Standards
Electrical Offset
Open W Ql.7~J
How Effective Is Accuracy Enhancement?
50. Response versus S 11 l-Port CMibration on Smith Chart
Following softkeys are located within the correction menu
Correcting for Measurement Errors
Ensuring a Valid Calibration
~or-co~e&on is on or off Press I- j~~~~~~~~~~
Interpolated Error-correction
Response Calibration
Calibrate Menu
Response and Isolation Calibration
S11 and S22 One-Port Calibration
TRL*/LRM* Two-Port Calibration
Select Cal Kit Menu
Restarting a Calibration
Cal Kit Menu
Modifying Calibration Kits
Procedure
Definitions
Following are definitions of terms
Modify Calibration Kit Menu
TIhble 6-5. Standard DelInitions
Detie Standard Menus
Application and Operation Concepts
Characters
Impedance different from system ZO
Described next
Label Standard Menu
~~,~~~~~~~
‘Ihble 6-6. Slamlard Class Assignments
Calibration
Calibration. For default calibration kits, this is the thru
Cal kit menu. It will be saved with calibration sets
Verification procedure may be used
Verify performance
TRL lkrminology
Why Use TRL Calibration?
TRL%RM* Calibration
How !CRL*/LRM* Calibration Works
TRL* Error Model
Same during the isolation calibration and the measurement
IsoIation
Frequencies is often times physically impossible
Source match and load match
54. Typical Measurement Set up
Requirements
No loss. Characteristic impedance ZO need not be known
Length
Let Fl = 1000 MHz
Where = frequency l=lengthofline
Application and Operation Concepts
Selections under this menu
Where
Or match &n&d ~~~~~~~~ .gQ or to the system
Menu and ~~~~~~~~. with the defie timdad menu me ignored
Is used to set the reference plane ~~~~~~~..~~~
Calibrated Power Level
Power Meter Calibration
Associated with power meter calibration
Primary Applications
Power Meter Calibration Modes of Operation
Loss of Power Meter Calibration Data
Interpolation in Power Meter Calibration
55. ‘I&t Setup for Continuous Sample Mode
Network Analyzer Power Meter Power Sensor
Power Sensor Calibration Factor List
SpeedandAccuracy
Number of Beadings Sweep Time Characteristic
Corrected
57. Alternate and Chop Sweeps Overlaid
Alternate and Chop Sweep Modes
Modify the Cal Kit Thru Definition
Matched Adapters
58. Instrument State Function Block
Using the Instrument State Functions
HP-IB Menu
System Controller Mode
HP-IB Status Indicators
= talk mode = service request SRQ asserted by the analyzer
~.&.. .?....bLi.... ...l
Copy Mode
Using the Parallel Port
Gpio Mode
Instrument
System Menu
~~~~~..~~~~~ provides access to the instrument mode menu
Limits Menu
Ikmi% tiih
Edit Limits Menu
Offset Limits Menu
Knowing the Instrument Modes
External Source Mode
Page
If you press @KJ ~~~~~~~~~~
‘lhble 6-8. External Source Capture Ranges
CW=e Bange
Pical Test Setup
60. Typical ‘l&t Setup for a Frequency Offset Measurement
Application and Operation Concepts
61. Typical Harmonic Mode ‘I&t Setup
Bhximum Fundamental Frequency
To OFF to allow alternating sweeps
Transform Menu
Time Domain Operation Option
General Theory
Time Domain Bandpass
63. a Reflection Measurement of Two Cables
‘I&ble 6-10. Time Domain Reflection Formats
Transmission Measurements Using Bandpass Mode
Setting frequency range for time domain low pass
Reflection Measurements In Time Domain Low Pass
Fault Location Measurements Using Low Pass
E M E N T E P R E S P O N S E P U L S E R E S P O N S E
Transmission Measurements In Time Domain Low Pass
PgBlQ6-c
Time Domain Concepts Masking
69. Transmission Measurements Using Low Pass Impulse Mode
70. Masking Example
10 90%
Sidelobes
Example
Where AF’ is the spacing between frequency data points
= 100 x lo-’ seconds
= 100 x lo-’ 6 x 3 x l$ m/s
Resolution
\I I
75. Sequence of Steps in Gating Operation
Transforming CW Time Measurements Into the Frequency Domain
‘able 6-13. Gate Characteristics
Forward Transform Measurements
I i iiiii t
~~~~~~
78. Combined Effects of Amplitude and Phase Modulation
80. Range of a Forward Transform Measurement
Wst Sequencing
ZoF the ~~~~~~~~
Type of Command Size in Bytes
Active entry command 1 per digit
Sequencing Menu
Results for each input power level applied to the amplifier
Parallel in ETS OUT Bits
Sequencing Special Functions Menu
Commands require you to enter the destination sequence
Sequence Decision Making Menu
Decision Making Functions
Naming Files Generated by a Sequence
HP-GLConsiderations Entering HP-GL Commands
Label HP-GL comman& Ia
Plot absolute HP-GL command PA
Amplifier parameters
Amplifier Tksting
Gain Compression
85. Diagram of Gain Compression
Metering the power level
Difficulty selecting the correct signal to measure
Mixer Testing
Frequency Offset
Tuned Receiver
Accuracy Considerations
Mixer Parameters That You Can Measure
Attenuation at Mixer Ports
J j j i
Filtering
92.Examples of Up Converters and Down Converters
93. Down Converter Port Connections
You a s&& either ~~~~~,~~~~~ or ~~~~,~~~~,~
94. Up Converter Port Connections
LOFeedthru/LOtoRFLedage
Conversion Loss
Isolation
SWR / Return Loss
Conversion Compression
Phase Measurements
Phase Linearity and Group Delay
Amplitude and Phase Tracking
Applicationmd OperationConcepts
Connection Considerations
Reflected Signal
Adapters
Worst Case System DiBtiVity 28d.B 17dEI 14 dE3
If You Want to Design Your Own Fixture
Fixtures
Fixtures and Non-Coaxial Measurements
Reference Documents
General Measurement and Calibration Techniques
On-Wafer Measurements
Dynamic Range
Specifkations and Measurement Uncertainties
HP 8763E 6OQ with 7-mm Test Ports
HP 8753E Measurement Port Specifications
Frequency Range
HP8753E Wiih HP85032B Calibration Kit
HP 8763E SO@ with Type-N Test Ports
HP8753E Wiih HP85033D Calibration Kit
HP 8763E SO@W with 3.6~mm Test Ports
GHz to 3 GHz
HP 8763E 76Q with Type-N Test Ports
Applies at 26 f6 C t Typical Performance 15dB,30kHzto6OkHz
HP 8763E 7612 with Type-F Test Ports
Instrument Spectications
‘lhble 7-12. HP 8753E Instrument Specifications 1
‘Ihble 7-12. HP 8753E Instrument Specifkations 2
‘lhble 7-12. HP 8753E Instrument Specifications 3
‘Ihble 7-12. HP 8753E Instrument Specifhtions 4
‘Ihble 7-12. EP 8753E Instrument Speciikations 5
‘Ihble 7-12. EIP 8753E Instrument Specifications 6
Measurement Throughput Summary
HP 8763E Network Analyzer General Characteristics
Probe Power
Front Panel Connectors
Rear Panel Connectors
Remote Programming
Video Output VGA OUT
External Auxilhry Input AUX Input
Display Pixel Integrity
Line Power
Parallel Port
232
General Conditions
Environmental Characteristics
Internal Memory
Weight
Cabinet Dimensions
Page
Menu Maps
Page
Menu Maps
IrCOPY
Page
Format Menu LOG MAG DELA,’ Smith Chart Polar LIN MAG SWR
MAX
+ RefIFWD
MenuMaps
SAVE/RECALL MEN + Save State Recall
MenuYaps
Page
MenuMaps
Pg657e
Key Definitions
Analyzer Functions
Guide Tkrms and Conventions
Set to the current adive -ker position, using the ~~~
Key Definitions
At the St& of the averaging or following ~~~~~~~~~~
Ad for specifying the calibration s-d=& used. me ~~~
Key Dsfinitions
Key Definitions
Mo&fication.\ ~~~~~~~~lt~\brings up the printer color
~~~~~~~~~~~~~~~ the preset condition, both channels have
Key Definitions 8-l
2 Key Definitions
Sequence position Sequence 1 through 6. ~~~~~~~~
Key Definitions
S21
~~~~~~~
Key Definitions
8 Key Definitions
Key Definitions 9-l
Turns limit. .I lines on or off. lb define limits, use
With the &@&ElV &3 softkey, if it is to be used later
Key Definitions B-21
Lxm
Switched on. Thirty lines of data are listed on each
Stimulus menu
Edit subsweep menu. Up to 30 frequency subsweeps
Let G .m4
Ldab AlO Wfset ILocal
LWX $%QXlXl% Sequence Filenaming
#F$
F4MEt + ,START
Hold mode for one measurement
Stimulus settings
Couples the marker stimulus values for the two display
Allows the marker stimulus values to be controlled
Moves the active marker to the minimum point on the trace
Is used to omit the isolation portion of the calibration
Selects the calibration standard load as being offset
Completes the selection in the Offset Load Menu
Drn SB
When editing a sequence, False Tg .&ZLlZGT appears when you
Is used to set the same power levels at each port
Configures the analyzer for a plotter that has a parallel
With the plotter
Directs plots to the selected disk internal or external
Frequency and power loss value
Allows you to set different power levels at each port
FRXif Hii tXWR
Key Definitions
Key Definitions
RsE#kswa, Value
Measures the reverse isolation of the calibration standard
KRSPti#SE
Gggs&fi
’F7
Key is disabled if ‘~~~~~~~ is set to ~~~
~~~~~~~~~~ menu
Key Definitions
Kay Definitions
To temate the smdwd definition
Key Definitions
Key Definitions
Is used to specify the arbitrary impedance of the standard,
~~~~~~~~~~~~~
Men ~~~~~~~~ or ~~~~~~~~ is pressed, a
Key Definitions B-61
~~~~~~~~~~ above
Key Definitions
Cross Reference of Key Function to Programming Command
Anab
Menucal
M4HEH
?lZAXJ.LT CXtLUH
DEFAULT,. i?RXllT f%KtVP
MARKF-AUV
OFFlPon #iv
Harmoff
Lintdata
Markmidd
Ofls
Titp
Pric
‘fhble Cross Reference of Key Function to Programm ingbmmand
Resd
Labesbba
Stop
Limtsl
Seatarg
Trackoff
Yellow
Softkey Locations
‘Ittble 9-2. Softkey Locations SoftkeyFront-Panel Access Key
‘Ihble 9-2. Softkey Locations
Key Definitions
Key Definitions
~~~ ~~~~~~~~~
Able 9-2. Softkey Locations SoftkeyFront-Panel Access Key
Key Definitions
Lhble 9-2. Softkey Lacations SoftkeyFront-Panel Access Key
$84 Iey Definitions
‘lhble 9-2. Softkey Locations SoftkeyFront-Panel Access Key
‘lhble 9-2. Softkey Locations SoftkeyFFont-Panel Access Key
Ble 9-2. Softkey Locations SoftkeyFront-Panel Access Key
‘lhble 9-2. Softkey Locations SoftkeyFront-Fanel Access Key
’hble 9-2. Softkey Locations
‘lhble 9-2. Softkey Locations SoftkeyFront-Rmel Access Key
‘Ihble 9-2. Softkey Locations SoftkeyFront-Panel Access Key
‘able 9-2. Softkey Locations
Able 9-2. Softkey Locations SoftkeyFront-Panel Access Key
7hble 9-2. Softkey Locations ISoftkeyFront-Panel Access Key
‘Ihble 9-2. Softkey Locations
Error Messages
Error Messages in Alphabetical Order
Analog BUS Disabled IN6KHZ if BW
Ascii Missing ‘VAR’ Statement
Blockinputlengthehhor
CANTSTORE/LOADSEQUENCE, Insufficientmemory
Correction and Domain Reset
Deadlock
Diskis Writeprotected
Duplicating to this Sequence not Allowed
File not Found
~ ..~~~.. .. .., .,~~,~
IFBWKEYDISABLED, Editlistmodetbl
Error Number You pressed an undefined softkey
9in progress. Start a new calibration
Order to use the ~~~~,~~~ softkey function
Error Number See error number
Error Number See error number 57
Plot Aborted
Error Number The parallel port printer is not accepting data
PRINT/PLOTINPROGRESS, Abortwithlocal
Probepowershut Down
Selectedsequenceisenpty
Slides Aborted Memoryreallocation
Sweep, pres LMenu ~~~~~~ ~~~~~~, or ~~~~~~~~~
TOO Manynested SEQUENCES. SEQ Aborted
WAITINGFORHP-IB Control
Error Messages in Numerical Order
Error Messages 1O-28
Error
Device not on, not connect, wrong addrs
IN-zErl
No Memory Available for Sequencing
List Mode OFF Invalid with LO Freq
Analog BUS Disabled in 6 KHZ if BW
Error Number
Calibration Kits
Compatible Peripherals
Adapter Kits
Verification Kit
Test Port Return Cables
Transistor Test Fixtures
Power Limiters
System Testmobile
System Cabinet
Interface Cables
Mass Storage
HP-IB Cables
‘Ihble 1 l-l. Keyboard ‘lkmplate Definition
Keyboards
Analyzer Function
Keyboaxd Analyzer Function Kety Name
Sample Software
Controller
External Monitors
Commended Color Monitors
Peripheral Connections to the Analyzer
Connecting the Peripheral Device
If the Peripheral is a Printer
Cotiguring the Analyzer for the Peripheral
=.~~~~~.........~.......~
Appears
Print function as follows
Until the correct function appears
‘.’ .~
Z...... iizz......ii.w.....A........w..i.i
Enter the volume number
Enter the HP-IB address of the power meter, followed by @
HP 436A HP 437B or 438A
Press Local and select one of the following
Press $m$&& ad enter the au-rent year, fdlowed by Ixl
Configuring the Analyzer to Produce a Time Stamp
HP-IB Programming Overview
Device Types
HP-IB Operation
Unaddress and revert to an idle state
HP-IB Bus Structure
REN Remote Enable
SRQ Service Request
Data lines carry device-dependent instructions or data
EOI End or Identify
Does not respond to parallel poll
Full-acceptor handshake
Complete device clear
No extended listener capabilities
= ‘IU mode = Service request SRQ asserted by the analyzer
HP-II3 Status Indicators
Next lower address
System-Controller Mode
Code Naming Convention
Analyzer Command Syntax
Valid Characters
User Graphics
HP-II3 Debug Mode
KHz Kilohertz US Microseconds MHz Megahertz
GHz Gigahertz
Types of Memory and Data Storage
Preset State and Memory Allocation
Non-Volatile Memory
Preset State and Memory Allocation
Storing Data to Disk
‘&ble 12-2. SuiIix Character Definitions
Conserving Memory
Using Saved Calibration Sets
Register in which it is stored
Preset State
‘Ihble 12-3. Preset Conditions 1
‘lhble 12-3. Preset Conditions 2
Able 12-3. Preset Conditions 3
Taker/listener
Default color values
An instrument state are cleared
Sequence 1 through 5 are erased
Power Meter Type is set to HP 438A/437
HP-IB Addresses are set to the following defaults HP 8753E
9600
Xon-Xoff
CITIllle Keyword Reference
CITIfile Data Format
Header part CITIFILEA.0190
This section will dehne the following terms Package Header
Data part
23491E-3,-1.39883E-3 00382E-3,-1.40022E-3
CITIfile Keyword
Data Sl,l RI
#NA VERSIONHP8510B.05.00
Example 4,861O S-Term Frequency List Cal Set F’ile
Conclusion
CITINe Keyword Reference
Is supported in revision A.O1.OO
Don’t change when the independent variable changes
Variable
Commonly used array names include the following
Determining System Measurement Uncertainties
Sources of Measurement Errors
Abl, Ab2 = dynamic accuracy = frequency
Sources of Random Errors
Measurement Uncertainty Equations
Sources of Additional Measurement Errors
Reflection Phase Uncertainty Erp
Efnf = effective noise floor
Transmission Uncertainty Equations
Dynamic Accuracy
Transmission Phase Uncertainty Etp
Determining Expected System Performance
Procedures
Characteristic Vdues ‘lhble
Measurement Uncertainty Worksheet 1
Page
Page
Page
GHz operation option
Specifications
75Q Impedance option Mm test ports
Active
Format, 419 auto sweep time mode
Allowing repetitive switching Switch protection ~~~~~~ 4
Enabling
Key
To key cross reference, 9-54 compatible
Mode Down converter port
Connecting peripherals, 1 l-8 connections, 6 Adapters
Group delay measurement
Conhguring
Electrical Delete display option, 1-13 deleting
Definition Calibration standards, 5-27 delay
Deviation from linear phase measurement
Display functions, 6-42 color
Linear magnitude, 6-36 log magnitude, 6-32 phase
DTl responds to a group execute trigger
Increasing Limitations, 7-l E2 W-state drivers, 11-19 edit
Signal flow in a mixer
ESD precautions Exammmg calibration constants, 5-27 example
Swept if conversion loss measurement
Fan location, l-11
Receiver and source requirements, 6-122 receiver frequency
Area of display, l-10 arrays Menu, 6-32 giizj zkzz
Frequency domain concepts, 6-125-145 transform from CW time
Isolation, 5-14 error-correct for full two-port
Calibrate the analyzer receiver to measure absolute power
Measure electrical length and phase distortion
Define the print
Set frequency span with markers, 2-29 set source power
Set auto sweep time mode
Domain
Print a sequence Print multiple measurements per
LIF Input ports menu
Hpgl
List values
6-51 It, 6-11 @J, 6-78 0, 6-11 @jiiJ, 6-42 entry, 6-9-l
InstAent state, 6-110-116 &iJ
Magnitude and insertion phase response measurement
Low pass mode
Softkey labels, l-10 softkeys
LOG MKR, 2-25 Loop counter sequence
Using swept list mode
Measurement frequencies, diagram, 3-10 measurement points
Parameters set with markers, 2-26 sequence
75Q type-F test ports 75Q type-N test ports
Tuned receiver mode Up conversion
Accuracy Amplitude and phase tracking, 6-167 attenuation
Iavp
@g$, 8-6 @iii,8 68-7
CaI kit thru definition, 5-47 modifying Sequence
New features to the analyzer, l-2 ~~~~
Multiple sequence cascading
Printing or plotting, 4-30 operation
Parameters set with markers, 2-26 center frequency
Points Datahow to reduce
Peripheral
~~~~.~~~ 4
Configuration, 4-4, 49, 11-9 mode
Multiple measurements per Solving problems ‘amji$J& use
Polar or Smith format markers, 2-22 port 1 and port2, l-6
Printing or plotting list values or operating parameters
Modifying Trmm calibration standards Offsetting limit lines
Error-correction for one-port reflection measurements
Values Resetting the printing parameters to default values
Response error-correction for reflection measurements
Using delta a markers
Setting center frequency with markers
Using ~~~~~ to .&jvate a tied
Viewing the measurement data and memory trace Procedures
Retention, 4-33 Re/Im MKR, 2-25, 2-26 relative
Relative velocity for time domain, 2-90 remote control
Running
Searching for values with markers, 2-32 bandwidth
@iG
Service request asserted by the analyzer S
Stop frequency Setting with markers Stopping
Spectral purity characteristics, 7-10 spurious signals
Specify
Standarddehnitions Entering
Test set
Testing with Iimit lines, 2-46 testmobile
Active channel display, 2-9 titling
Test set switch, controlling the, 5-54 test using limits
Forward transform mode, 6-126 gating
Weight Widen system bandwidth, 5-52 windowing Time domain
How to set
Type-N calibration standard sex, 5-6 type-N test ports
Understanding S-parameters, 6-29 units