ADDITIONAL DATA FOR | ● | % All Lines Busy. The percentage of time in each hour that all lines in the | ||||||||||||||
DAILY CALLS |
| group were simultaneously busy. |
|
|
|
|
|
|
|
| ||||||
| ● | Busiest hours. The three hours with the largest total holding time for ACD | ||||||||||||||
|
| calls. The busiest hour is shown first (lower portion of screen), followed | ||||||||||||||
|
| by the second and third busiest hours. |
|
|
|
|
|
|
| |||||||
|
|
| NOTE: Calls in progress at the end of an hour are included in the | |||||||||||||
|
|
| statistics for the hour in which the calls were completed. |
|
| |||||||||||
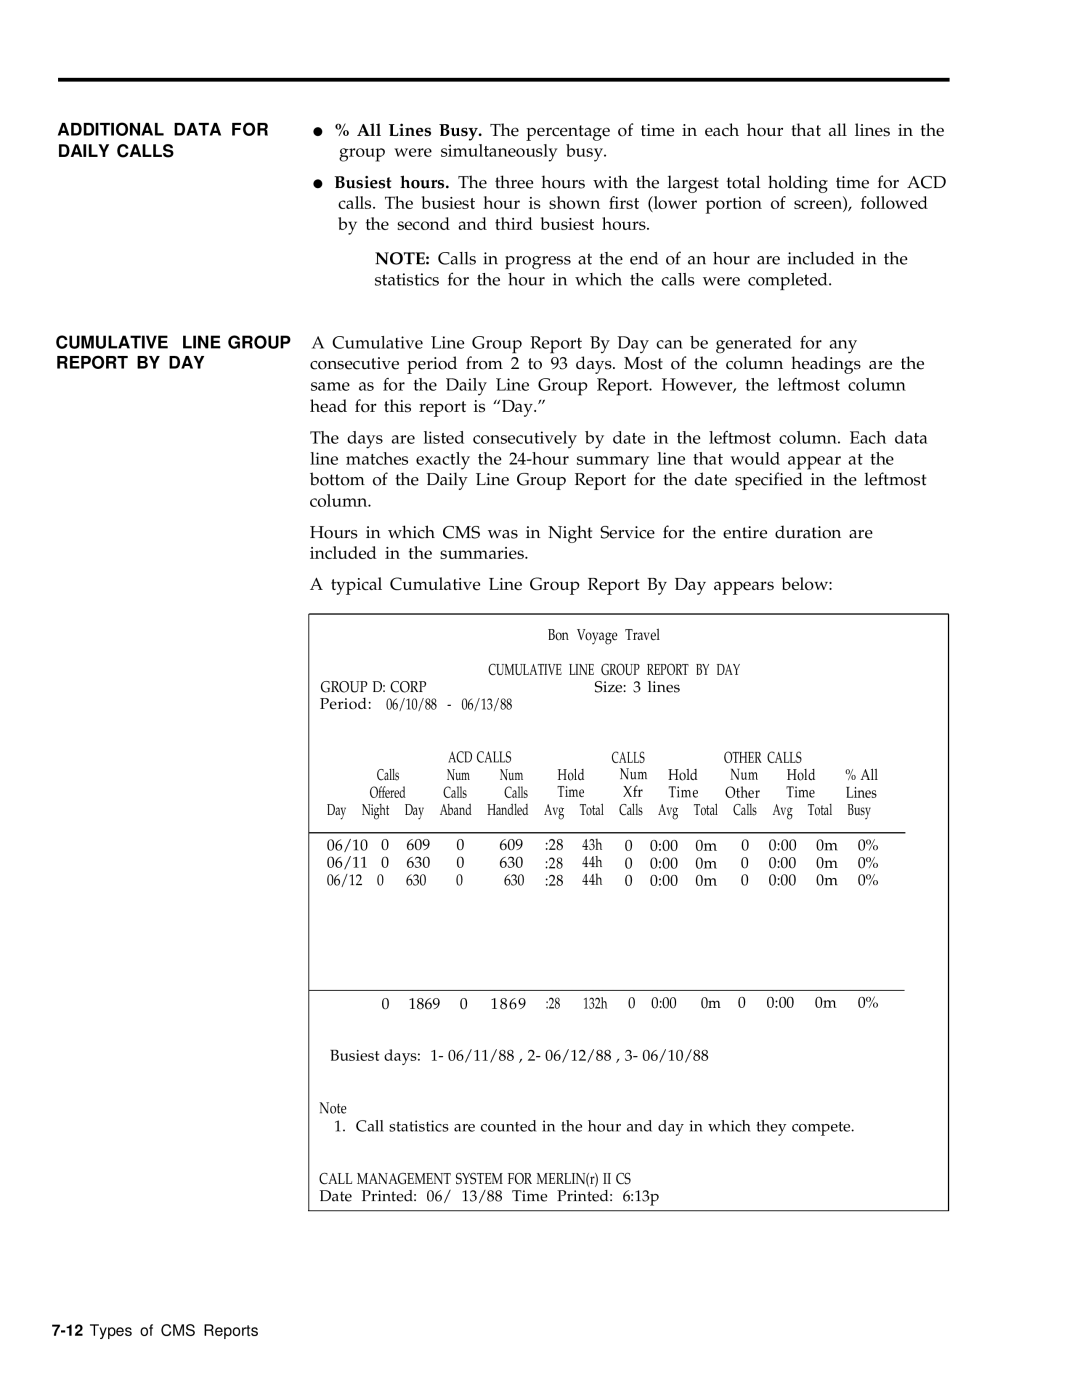
CUMULATIVE LINE GROUP | A Cumulative Line Group Report By Day can be generated for any | |||||||||||||||
REPORT BY DAY | consecutive period from 2 to 93 days. Most of the column headings are the | |||||||||||||||
| same as for the Daily Line Group Report. However, the leftmost column | |||||||||||||||
| head for this report is “Day.” |
|
|
|
|
|
|
|
|
| ||||||
| The days are listed consecutively by date in the leftmost column. Each data | |||||||||||||||
| line matches exactly the | |||||||||||||||
| bottom of the Daily Line Group Report for the date specified in the leftmost | |||||||||||||||
| column. |
|
|
|
|
|
|
|
|
|
|
|
|
|
| |
| Hours in which CMS was in Night Service for the entire duration are | |||||||||||||||
| included in the summaries. |
|
|
|
|
|
|
|
|
|
| |||||
| A typical Cumulative Line Group Report By Day appears below: |
|
| |||||||||||||
|
|
|
|
|
|
|
|
|
|
|
|
|
|
|
| |
|
|
|
|
|
|
| Bon | Voyage | Travel |
|
|
|
|
|
| |
|
|
|
|
|
| CUMULATIVE LINE GROUP REPORT BY DAY |
|
|
|
| ||||||
| GROUP D: CORP |
|
|
| Size: 3 lines |
|
|
|
|
|
| |||||
| Period: | 06/10/88 | - 06/13/88 |
|
|
|
|
|
|
|
|
|
| |||
|
|
|
|
| ACD CALLS |
| CALLS |
|
| OTHER CALLS |
|
|
| |||
|
|
| Calls |
| Num | Num | Hold | Num | Hold | Num | Hold | % All | ||||
|
| Offered |
| Calls | Calls | Time | Xfr | Time | Other | Time | Lines | |||||
|
| Day Night Day Aband Handled | Avg | Total | Calls | Avg | Total | Calls | Avg | Total | Busy | |||||
|
|
|
|
|
|
|
|
|
|
|
|
|
|
|
|
|
|
| 06/10 | 0 | 609 | 0 | 609 | :28 | 43h | 0 | 0:00 | 0m | 0 | 0:00 | 0m | 0% |
|
|
| 06/11 | 0 | 630 | 0 | 630 | :28 | 44h | 0 | 0:00 | 0m | 0 | 0:00 | 0m | 0% |
|
|
| 06/12 | 0 | 630 | 0 | 630 | :28 | 44h | 0 | 0:00 | 0m | 0 | 0:00 | 0m | 0% |
|
0 1869 0 1869 :28 132h 0 0:00 0m 0 0:00 0m 0%
Busiest days: 1- 06/11/88 , 2- 06/12/88 , 3- 06/10/88
Note
1. Call statistics are counted in the hour and day in which they compete.
CALL MANAGEMENT SYSTEM FOR MERLIN(r) II CS
Date Printed: 06/ 13/88 Time Printed: 6:13p