January
UDA2182 Universal Dual Analyzer Product Manual
Copyright 2008 by Honeywell Revision January
WARRANTY/REMEDY
Telephone
Abstract
Contacts
World Wide Web
Symbol Definition
Symbol Definitions
Contents
100
136
114
191
178
185
189
239
Tables
Figures
Resetting ORP Offset
Overview
Introduction
Communications Card Optional
Outputs
Relays
Infrared Communications
Features
High Noise Immunity
Password protection
Auto Clean/Auto Cal
Diagnostic/Failsafe Outputs
UDA2182 Universal Dual Analyzer
Specifications
Specifications
Resistive Load Rating 4A, 120/240 Vac
Declaration of Conformity
CE Conformity Europe
Specifications
What’s in this section?
Unpacking, Preparation, and Mounting
Introduction
Step Action
Procedure Procedure for Unpacking and Preparing the UDA2182
Unpacking and Preparing
Mounting
Panel Cutout
Panel Mounting Dimensions
Rear Panel Support Plate Dimensions
Pipe Mounting
Pipe Mounting Dimensions not to scale
Wall Mounting Dimensions not to scale
Wall Mounting Dimensions
Power Wiring
Avoid damage to components
General Wiring Practices
Safety precaution
Wiring for immunity compliance
Installing Power Wiring
Power Wiring Considerations
Disengage from the terminal boards
Power Wiring
Operating the Analyzer
UDA2182 Operator Interface all display items shown
Analyzer Overview
Function
Key Navigation
Function of Keys
Key
Displays Overview
Status Messages
Online Functions Display Details Functions
Process Variable
Values
Two Input Display
Input Displays
Selecting Control Display
PID Displays
Overview
Changing PID Parameters on the Display
To access the PID Parameters. You will see
To access the value or selection of each
Changing Parameters on the PID Display
Auto Cycle Displays
Access to Auto Cycle Displays
Displays
How it works
Cycle Interval
Hold Active
Probe Transit
Cycle Start Src
Manually Starting/Stopping the Auto Cycle
To access the Auto Cycle Operator Panel. You will see
Manual Starting/Stopping the Auto Cycle
Condition
Output Hold State Enabled
Auto Cycle Fail
Step AC n Extract Rinse Cal
Pharma Display
Pharmacopoeia Test Procedure
Pharma Display screen example Displays
Access to Pharma Display
To select Test pH After Stage 3 is selected
Selecting the Pharma Test on Display
To select Test µS/cm After Stage 2 is selected
Pharma Warning and Fail Signal
UDA for Cation and Degassed CO2 How it works
Cation Calc Display
Degassed CO2
PH Calculation from Specific and Cation Conductivity Setup
5 CO2 by Degassed Conductivity
Access to Cation Display
Calibration
Check pH Electrode System
Troubleshooting
Status Display Details
Access to Status Displays
PID Alarm
10Status Display
Relay States
Input Status
Output
Levels
Comm Status
Output of the Switch and Function Generator blocks
Aux Values
Variables
Auto Cycling
Configured
Status Parameter Status Definition Display Read Only
MACaddr Hi and MACaddr Low is the MAC address
Available only if both units of measure between
Press Until you see
Access to Event History Displays
Setup Chg 04.19 Alarm 1 On 03.15 Hold On Power On 03.09
Event History
Clear Event History
12Process Instrument Explorer Software
Features
Infrared communications
Ethernet port provides
Modbus Communications
Summary
Serial port provides
Configuration
UDA2182 Block Diagram
UDA2182 Block Diagram
Setup Group Overview
Main Setup Menu
Accessing the Main Menu
Configuration
General Rules for Editing
Basic Configuration Procedure
Enter
Basic Configuration Procedure
Exit
Signal Type Applies Source to Selections
Analog and Digital Signal Sources
Signal Sources
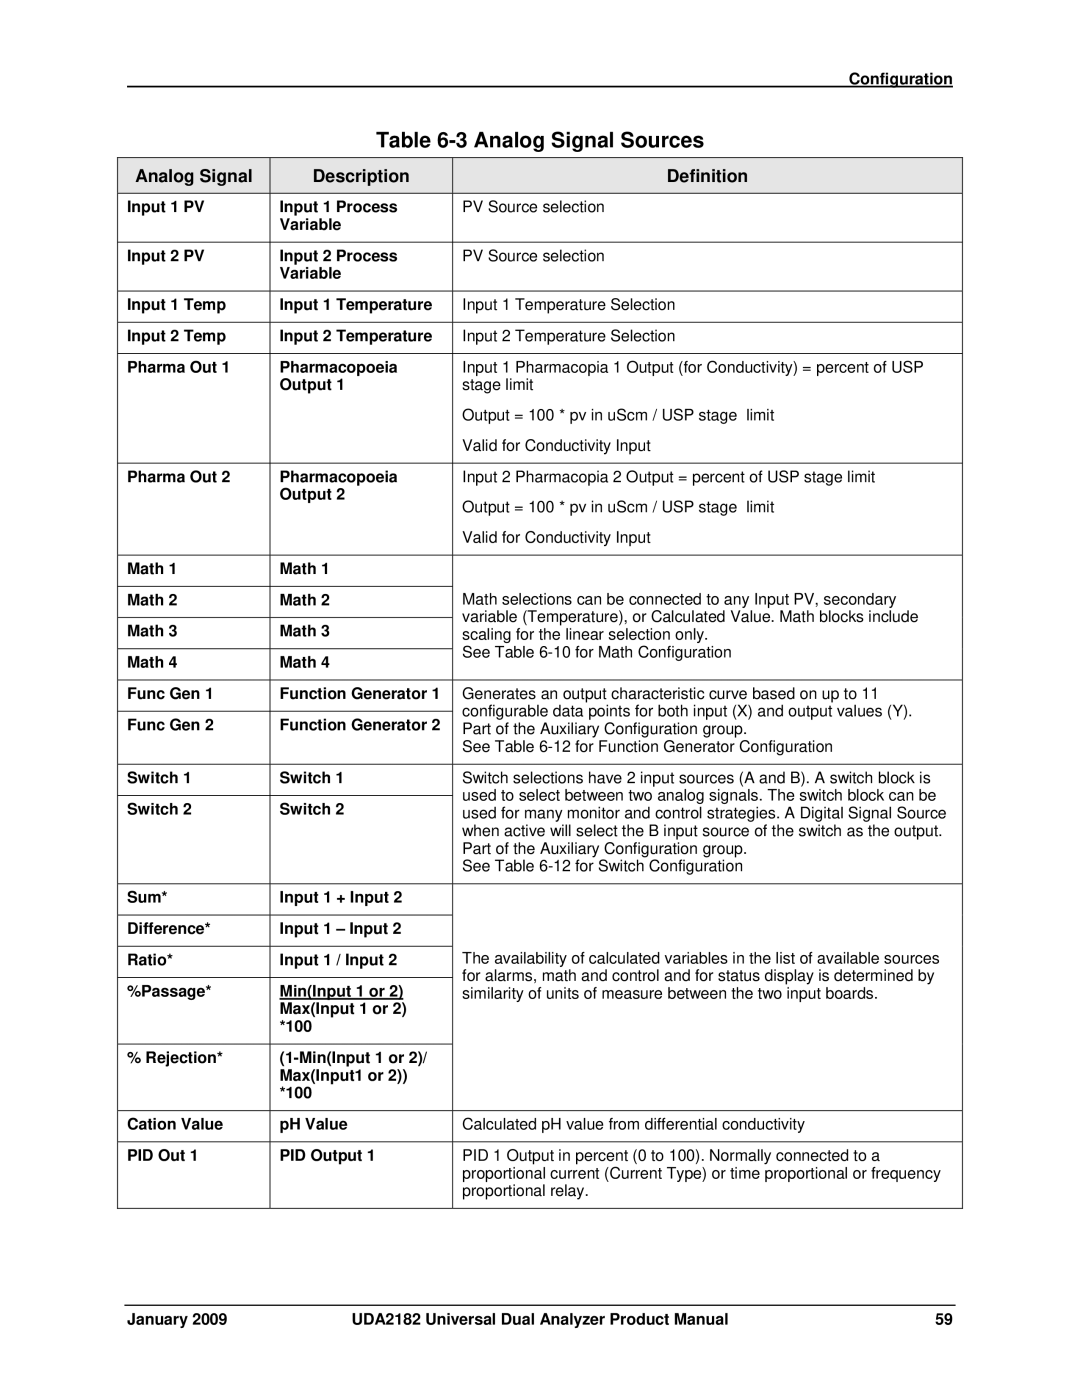
Analog Signal Description Definition
Analog Signal Sources
Digital Signal Description Definition
Digital Signal Sources
Out 2 Fault
DgtlVar
Input Configuration
Inputs Configuration
Accessing Inputs Menu
Default =
Default = 77ºF
Default = 25ºC
None default
8550 Ω Therm
Sub-menu Parameter
Following important differences
Default to
Cell Const Cell Const 0
Cond mS/m
NIST-default +
ISO-Default +
Cond
Only PV Type 000default
Selection Range Setting
H2SO4
NaCl default
Configured minutes value set here. When the Timer
Default = None
Default 10.000
Pharma Timer begins to count down from
Manual
Input Do Concen
Oxygen do concentration or percent saturation
5000Ω Therm
Default = 20.000
Outputs Configuration
Outputs Configuration
Accessing Outputs Menu
Parameters in %
Parameters in engineering units
Accessing Relays Menu
Relays Configuration Overview
Relays Configuration
Frequency
ON/OFF
Pulse Output
Range Switch using Math, Monitor, and Switch Blocks
Alarms Configuration
High default
Accessing Alarms Menu
Alarms Configuration
Monitors Configuration
10Monitors Configuration
Accessing Monitors Menu
For Low Monitor
Accessing Math Menu
11Math Configuration
Linear default
10 Math Configuration
Accessing Logic Menu
Logic Configuration
Latch
11 Logic Configuration
Func Gen Function Generator
Auxiliary Configuration
Switch
Sub-menu Parameter Selection or Range of Setting
Accessing Auxiliary Menu
12 Auxiliary Configuration
99999 to 999999 Default=
PID Tracking
PID Control Configuration
PID Tracking versus Manual Mode
Using Auto/Manual Switch
Configuration
13 PID Configuration
Accessing Control Menu
PIDn Config Table
PIDnAlarms Table
Failsafe default
Pida default
Reverse default
Manualdefault
9999 to
Enable default
PID 2 Tune Disable default
14 PID Tuning
PID 2 Alarms
15 PID Alarms
No Alarm default
Setpoint No Alarm default
Same as Alarm 1 Setpoint 1 Type
Input Board Type Auto Cycle Operation
Auto Cycling Configuration
Accessing Auto Cycle Menu
Auto Cycle 1 or Auto Cycle
Offdefault
Auto Cycling Configuration 16 Auto Cycling Configuration
To 100default =
To 28 default =
Default = Sunday To 31 default =
To 59 default =
Enable
PH Auto Cycling Configuration Example
17 Example Auto Cycling Configuration for pH
Selection Setting Resume Dly Mins
Resume Dly Mins
Analog
Variables Configuration
Accessing Variables Menu
18 Variables Configuration
19 Communication Configuration
17Communication Configuration
Accessing Communication Menu
Status display
Ethernet
20 Maintenance Configuration
Maintenance Configuration
Accessing Maintenance Menu
Option ID Number
Loops default
No default
Unit Identification
ISO/NIST factor
Nist default
AWG default
Feet default
Default UDA2182
Default Honeywell
Tag Names
Hour default
AM default
Off default
Output action occurs when the Enter key is
Inputs and Outputs Wiring
Immunity compliance
References
Recommended maximum wire size Recommended Maximum Wire Size
Shielded wiring for locations with interference
Avoiding interference
Inputs and Outputs
Accessing the terminals
Wiring Terminals and board Location Procedure
Wiring terminals and board location
Procedure for installing Input and Output wiring
Durafet
Direct pH/ORP Input Wiring Diagrams
Durafet
Terminal Designations for Meredian II Electrode
Glass Meredian
ORP
Terminal Designations for HPW7000 System
HPW7000
Terminal Designations for HB Series pH or ORP
HB Series pH or ORP
Black
Glass Meredian External Preamp1
Blue
Green
+ 10 Volt Supply
RTH 3rd Wire
Durafet II External Preamp
Durafet II Cap Adapter
Durafet III Cap Adapter
Brown Blue
Conductivity
Ground screw
Dissolved Oxygen
Yellow
Wire to chassis
Cable shield Violet
To chassis ground screw Clear
RJ45 Ethernet Connection RS 485 Connection
Communications Card
Outputs
Power Supply/Analog Output/Relay Output Card
20 Terminal Designations for Option Board
Option Card
Input Calibration
Input PV Cal Input Temp Cal Output Cal Cal History
Accessing the Main Calibration Menu and sub-menus
Calibration Menu
Conductivity
PH/ORP and Conductivity Overview
PH/ORP Calibration
Selection and care of electrode system or cell essential
Recommendations for Successful Measurement and Calibration
PH Calibration
Using the restart screen
Calibrating pH Electrodes Using Automatic Buffer recognition
Standard pH Buffer Values
Calibration functions
Use To select Input PV Cal Enter
NIST/USP default
Step Action Screen
Press
Place probe in Buffer
Press Enter when stable
Step Action Screen Press Enter
Auto Buffer Cal
Buffer 2 stability check
Buffering Method of Calibrating pH Electrodes
Buffer Cal
Procedure for Buffering Method of Calibrating pH Electrodes
Step Action Screen Press
Input PV Cal Enter
Press Enter when stable
Sample Method of Calibrating pH Electrodes
Procedure for Sample Method of Calibrating pH Electrodes
Change to Sample Value
Sample Cal
Place probe in Sample
Special instructions for high-purity water applications
Resetting pH Offset and pH Slope
ORP Calibration
ORP Calibration Using Reference Solution
Procedure
This will standardize the unit
Procedure for Calibrating ORP Analyzer Using Voltage Input
ORP Calibration Using Voltage Input
Press
Sample Cal ORP Offset
Viewing and Resetting ORP Offset
Reset ORP Offset
Entering the Cal Factor for each cell Introduction
Conductivity Calibration
Out-of range-values forced to closest limit
Determining TDS conversion factor
Performing Calibration Trim Introduction
Concentration M Conductivity microSiemens Per cm
Conductivity of Potassium Chloride Solutions at 25 C
Error Messages
Sample Cal Cal Trim1.00
Resetting Calibration Trim
Cation pH
10 Procedure for Sample Method of Calibrating Cation pH
Cation pH Calibration
Input PV Cal Enter Press
Enter = recal, Exit = exit
Cal Complete
To recalibrate, press Enter
Sample Cal PH Offset0.00
Resetting pH Offset
Do’s and Don’ts for Dissolved Oxygen Calibration
Dissolved Oxygen Calibration
Air Cal
Use To select Input 1 or 2 do Cal Enter
Wait for cal complete
Press Enter when ready
Enter Place probe in air
Enter Cal stability check
January UDA2182 Universal Dual Analyzer Product Manual 169
Enter Place probe in sample
Enter to save when the value
Exit to cancel
Pressure Cal
Calibrating the Integral Pressure Sensor Introduction
13 Calibrating the Integral Pressure Sensor
Pressure Sensor Cal
Running a Probe Bias Scan Introduction
Test initiation
Interpretation of figure shown above is as follows
Display Graph
55V 80μA 240 160 ΜA 00 0.2 0.4 0.6 0.8
Procedure 14 Running a Probe Bias Scan
January UDA2182 Universal Dual Analyzer Product Manual 175
176
IN1 do CAL
Resetting Pressure Offset or Bias Volts
Outputs Calibration
Required equipment
Output Calibration
180
Procedure Procedure for Calibrating Analyzer Outputs
Use To select An Analog Output to be Calibrated Enter
Case
Step Action Screen Use To select
MA Offset and repeat
Process
Resetting Output 1 Offsets example
Viewing and resetting 20mA and 4mA Offset
10.1Overview
Temperature Input Calibration
Input Temp Cal Enter
Temperature Input Calibration
Procedure Procedure for Calibrating the Temperature Inputs
Limit is ± 5ºC ± 9ºF
Resetting temperature offset
Viewing and resetting Temperature Offset
Calibration Records Cal History items
Calibration History Overview
Clear Calibration History
12.1Overview
Diagnostics and Messages
= 1 or
Measurement Errors
System Status Messages
Status Messages
PH/ORP/DO
Calibration Diagnostics
Probe Calibration Diagnostics
Fail Message Reason
Auto Cycle Fail Messages
Auto Cycle Fail Messages
Status Condition
12.5Pharma Fail Messages
Pharma Fail Messages
Fail Condition
13.1Overview
Ethernet and Communications
14.1Overview
Accessories and Replacement Parts List
Kit/Part Number Description Quantity
Part Numbers
Part Numbers
Appendices
Table of Contents
Example of a Conductivity Loop
January UDA2182 Universal Dual Analyzer Product Manual 201
Ft of 18 AWG coax
January UDA2182 Universal Dual Analyzer Product Manual 203
Technique for cyanide destruction
Uses of cyanide solutions
Appendix C Cyanide Waste Treatment
Titration curve
First Stage of Cyanide Destruction
Raise pH and oxidize cyanide
Neutralize and further oxidize cyanate
Importance of pH control
Reliable measurement with gold electrode
Second Stage of Cyanide Destruction
ORP Potential a Measure of Status of Reaction
Batch Treatment
Necessity for removal of chromium ion from wastewater
15.5Appendix D Chrome Waste Treatment
Use of Chromates
Corrosion inhibition
Lower pH and add reducing agent
First Stage of Chrome Removal
ORP Potential a Measure of Status
Second Stage of Chrome Removal
January UDA2182 Universal Dual Analyzer Product Manual 211
Conductivity/Resistivity/TDS Difference
Appendix E Two-cell Applications
Ion Exchange
Reverse Osmosis
Parts Rinsing
Softener Monitor
Steam Power Measurements
January UDA2182 Universal Dual Analyzer Product Manual 215
Calculations for conductivity, resistivity, and TDS
Set cal factor and calibration trim for ideal conditions
Data for Concentration Range Measurements
Concentration values
Hints for Reducing Noise
15.8Appendix G Noise Testing, Dissolved Oxygen Application
Check for probe membrane leakage
15.9Appendix H do Probe and Analyzer Tests
Check that analyzer is working
January UDA2182 Universal Dual Analyzer Product Manual 221
Salinity
Temperature
Pressure
Charging Currents
Faradaic Currents
Residual Currents
Electrode Conditioning Currents
Faradaic Interferences
Sulfite Based Zero Testing
15.12Appendix K Percent Saturation Readout
Dissolved Oxygen Solubility vs. Temperature
15.13Appendix L Leak Detection in PPB Applications
Equipment Needed
Oxygen Measurement Procedure
Example Calculation
To Calculate True Value
Typical Probe Installation
230
Automatic Cleaning and Calibration
15.16Appendix O Auto Clean and Auto Cal Examples
Auto Clean Setup
Automatic Calibration of ppb Dissolved Oxygen Probe
10 Auto Cal Setup
AutoClean Sequence and Piping
Appendix P AutoClean and AutoCal Theory and Piping
AutoCal Sequence and Piping
11 Automatic Electrode Wash Setup
12 Rinse and One-Point Calibration
Two-Point AutoCal Operation
238
Index
Conductivity Conductivity Calibration
January UDA2182 Universal Dual Analyzer Product Manual 241
Power Supply/Analog Output/Relay Output Card...132
Y, Z
244
January UDA2182 Universal Dual Analyzer Product Manual 245
Asia Pacific