Polycom DMA 7000 System Operations Guide
USA
Contents
Local Cluster Configuration
Device Management
MCU Management 131
Integrations with Other Systems 163
Conference Manager Configuration 193
Superclustering 227
Call Server Configuration 237
Site Topology 283
System Management and Maintenance 347
Users and Groups 311
Contents
DMA Operations Guide
System Reports 407
431
Index 539
Polycom DMA 7000 System Overview
Introduction to the Polycom DMA System
Conference Manager
Polycom DMA System’s Primary Functions
Call Server
RealPresence Platform API
SVC Conferencing Support
Polycom DMA System’s Three Configurations
Two-server Cluster Configuration
Single-server Configuration
Superclustering
See Signaling Settings on
System Capabilities and Constraints
System Port Usage
Port Protocol Description
Port Protocol Description
See Security Settings on
Be changed see Signaling Settings on
Accessing the Polycom DMA System
Polycom Solution Support
Working in the Polycom DMA System
Polycom DMA System User Roles and Their Access Privileges
Settings Dialog Box
Field Input Requirements
DMA Operations Guide Working in the Polycom DMA System
Menu/Icon Admin Provisioner Auditor
Management interface access privileges
API resource access privileges
Conference
Third-Party Software
Open Source Software
Modifying Open Source Code
License Information
Software Version License Link
BSD
Cddl
NSS
Nsis
SAX
UPX GPL Lzma
Polycom DMA System Initial Configuration Summary
Add Required DNS Records for the Polycom DMA System
Additional DNS Records for SIP Proxy
Additional DNS Records for H.323 Gatekeeper
License the Polycom DMA System
Verify That DNS Is Working for All Addresses
Set Up Signaling
Set Up Security
Set Up MCUs
DMA Operations Guide Set Up MCUs
Set Up MCUs Polycom DMA System Initial Configuration Summary
Connect to Microsoft Active Directory
Set Up Conference Templates
Test the System
Test the System
Security Certificates Overview
How Certificates Work
Forms of Certificates Accepted by the Polycom DMA System
PEM Pkcs #7
How Certificates Are Used by the Polycom DMA System
Certificate Settings
Frequently Asked Questions
Column Description
Certificate Signing Request Dialog Box
Certificate Information Dialog Box
Field Description
Certificate Details Dialog Box
Add Certificates Dialog Box
Field Description
Certificate Procedures
Section Description
Go to Admin Local Cluster Certificates
Install a Certificate Authority’s Certificate
Actions list, select Add Certificates
Create a Certificate Signing Request in the DMA System
Actions list, select Create Certificate Signing Request
Install a Certificate in the DMA System
Actions list, select Add Certificates
Remove a Certificate from the DMA System
Actions list, select Delete Certificate
Security Settings
High security
Field Description Maximum security
Custom security
Https
Field Description
DMA system so that it trusts the CA
Go to Admin Local Cluster Security Settings
Consequences of Enabling Maximum Security Mode
On the Troubleshooting Utilities menu, Top is removed
DMA Operations Guide
Login Policy Settings
Local Password
Password Complexity
Field Description Password Management
Session
Local User Account
Field Description Account Lockout
Banner
Account Inactivity
Reset System Passwords
Reset System Passwords
Local Cluster Configuration
Network Settings
Server
Field Description Shared Management
Turn on Auto-negotiation or set Speed and Duplex
Field Description Shared Signaling
Network Settings
Management Network Settings , except that under
General System
Routing Configuration Dialog Box
Time Settings
Licenses
FieldDescription Active License
SIP Signaling
Signaling Settings
Field Description Activation Keys
Device Authentication
Xmpp Signaling
Dma1.polycom.com5223
Signaling Settings Fields
Field Description Settings
Click Device authentication settings to go to
SIP Settings
Click the Device authentication settings link to go to
Xmpp Settings
Entry see Edit Guest Port Dialog Box on page 78 or
Add Guest Port Dialog Box
Signaling is turned off on the Security Settings
Then Require certificate validation for TLS is turned
Edit Guest Port Dialog Box
Add Guest Prefix Dialog Box
Edit Guest Prefix Dialog Box
Logging Settings
Local Cluster Configuration Procedures
Add Licenses
Select Product Activation
Click Generate
Go to Admin Local Cluster Licenses
Configure Signaling
Go to Admin Local Cluster Signaling Settings
Under Unauthorized ports, click Add
Under Unauthorized prefixes, click Add
Configure Logging
Device Management
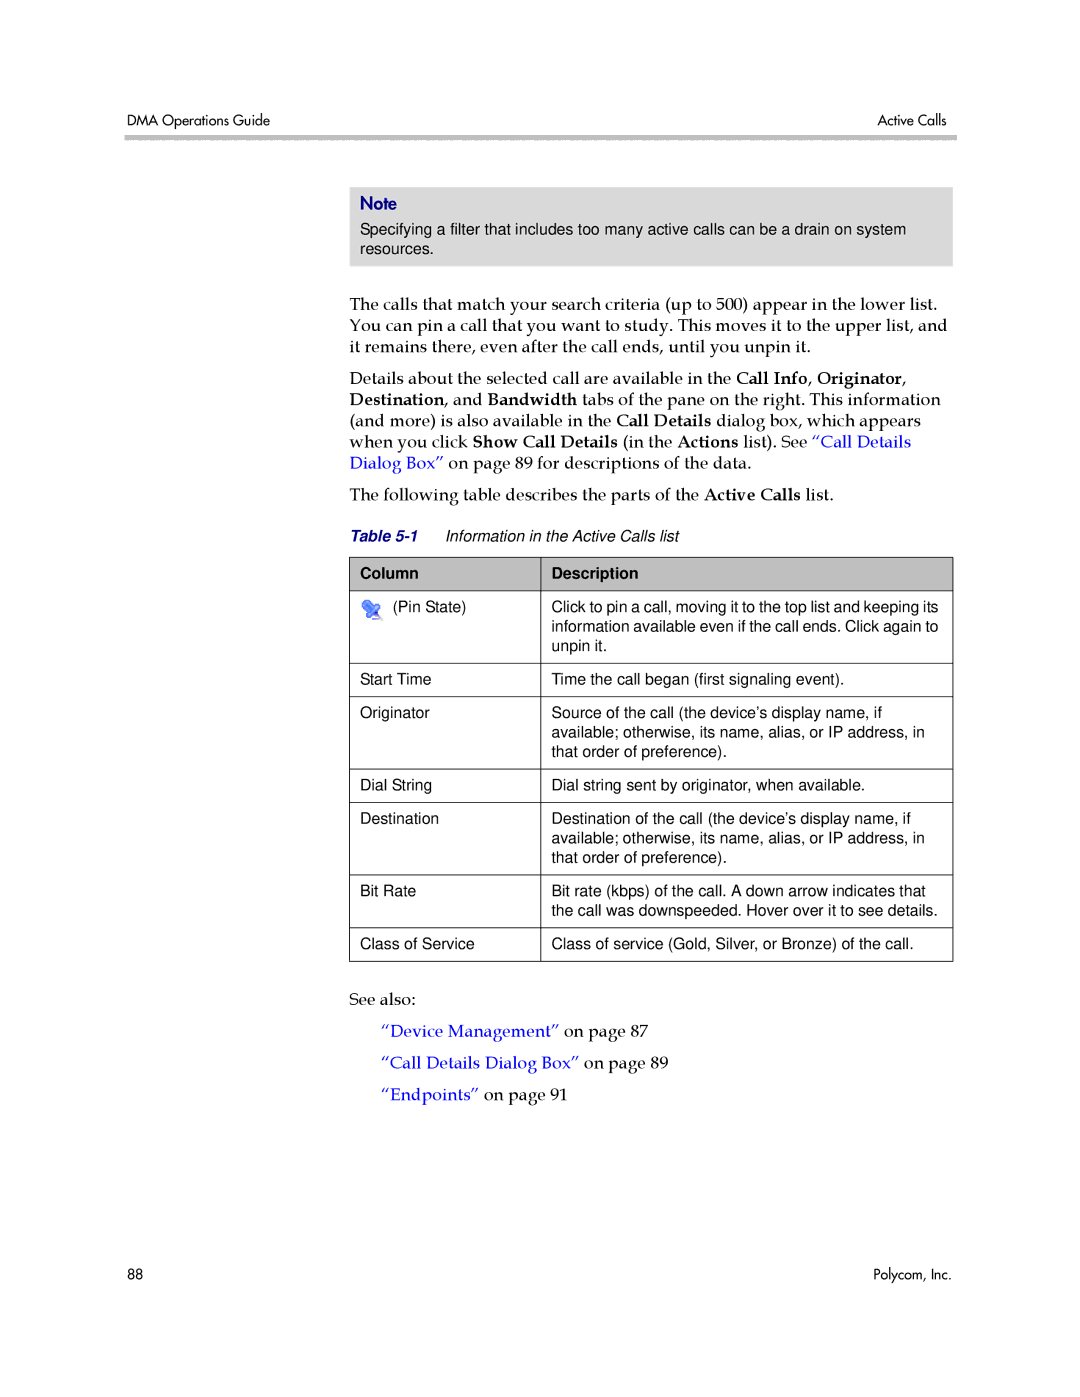
Active Calls
Information in the Active Calls list
Call Details Dialog Box
Tab/Field/Column Description Call Info
Tab/Field/Column Description Bandwidth
Call Events
Property Changes
QoS
Endpoints
Information in the Endpoints list
Column Description
Command Description
Takes you to Reports Registration History and displays
Names/Aliases in a Mixed H.323 and SIP Environment
Add Device Dialog Box
Add Device dialog box
Edit Device Dialog Box
Edit Devices Dialog Box
Add Alias Dialog Box
Edit Alias Dialog Box
Site Statistics
Associate User Dialog Box
Site Link Statistics
External Gatekeeper
Column Description External Gatekeeper
Add External Gatekeeper Dialog Box
Gatekeepers list
Authentication Mode
Apply the Resolve to external gatekeeper action
Column Description Postliminary
Edit External Gatekeeper Dialog Box
Debugging Dialog Box for Preliminaries/Postliminaries
Mode
External SIP Peer
Add External SIP Peer Dialog Box
Field Description External SIP Peer
Apply the Resolve to external SIP peer action, there is
Domain List
Field Description Postliminary
Use customized script
To header options
Template field
Field Description Authentication
Device Authentication
Authentication
External Registration
Edit External SIP Peer Dialog Box
To this peer server for resolution
Peer server to specific domains by adding
Rule action, such as Resolve to external address , is
118
SIP Peer Postliminary Output Format Options
Default To header for Microsoft. Equivalent to template
To Header Format Options
Request-URI Header Format Options
#orscheme##oruser#@#orhost#
Free Form Template Variables
Default Request-URI for Microsoft. Equivalent to template
Variable Description
To Header and Request-URI Header Examples
Original Template Result
Displayname
Sipuser@host Sipuser@peerHostIp Displayname
Add Authentication Dialog Box
Edit Authentication Dialog Box
Add Outbound Registration Dialog Box
Edit Outbound Registration Dialog Box
22Edit Outbound Registration dialog box
External SBC
Add External SBC Dialog Box
Column Description External SBC
Edit External SBC Dialog Box
Rule or the Dial endpoints by IP address dial rule both
25Edit External SBC dialog box
MCU Management
MCUs
DMA Operations Guide MCUs
See SVC Conferencing Support on
Information in the MCU list
Command Description
Unquarantine
Add MCU Dialog Box
Field Description External MCU
MCU
Direct dial-in prefixsession profile
PrefixdelimiterE.164 number
See Add Simplified Isdn Gateway Dialing Prefix
Profile. See Isdn Gateway Selection Process on
Media IP Addresses
Field Description Gateway Profiles
Postliminary
Edit MCU Dialog Box
Edit MCU dialog box
Direct dial-in prefixsession profile
Polycom, Inc 145
Add Session Profile Dialog Box
Edit Session Profile Dialog Box
Isdn Gateway Selection Process
148
MCU Procedures
Go to Network MCU MCUs
To edit an MCU
To delete an MCU
MCU Pools
7Information in the MCU Pools list
Add MCU Pool Dialog Box
Edit MCU Pool Dialog Box
MCU Pool Procedures
Go to Network MCU MCU Pools
MCU Pool Orders
11Information in the MCU Pool Orders list
Add MCU Pool Order Dialog Box
Edit MCU Pool Order Dialog Box
MCU Selection Process
MCU Availability and Reliability Tracking
+ 5 *1 / 1 + 5 = 5/6
+ 5 *1 / 1 + 5 =
+ 5 *5/6 / 1 + 5 = 31/36
MCU Pool Order Procedures
Go to Network MCU MCU Pool Orders
Integrations with Other Systems
Microsoft Active Directory Integration
164
Microsoft Active Directory
Connection Status
Conference Room Errors Report report
Active Directory Connection
Understanding Base DN on
Field Description Enterprise Conference Room ID Generation
Enterprise Chairperson and Conference Passcode Generation
Active Directory Integration Procedure
To integrate with Active Directory
170
Polycom, Inc 171
172
Understanding Base DN
Use this Base DN To include the following
Adding Passcodes for Enterprise Users
Polycom, Inc 175
About the System’s Directory Queries
When you click Update on the Microsoft Active Directory
User Search
Group Search
Index used idxobjectCategory32561N
Global Group Membership Search
Attribute Replication Search
Configurable Attribute Domain Search
Service Account Search
Domain Search
Active Directory
Microsoft Exchange Server Integration
Microsoft Exchange Server Integration
Microsoft Exchange Server
Exchange Server Integration Procedure
Go to Admin Integrations Microsoft Exchange Server
Resource Management System Integration
Resource Management System
Join Resource Management System Dialog Box
Resource Management System Integration Procedures
Juniper Networks SRC Integration
Juniper Networks SRC
SRC
Go to Admin Integrations Juniper Networks SRC
Juniper Networks SRC Integration Procedure
IpipAddress=192.168.70.228
192
Conference Manager Configuration
Conference Settings
Go to Admin Conference Manager Conference Settings
Pool Orders on
Two Types of Templates
Conference Templates
Standalone Templates
Templates Linked to RMX Profiles
About Conference IVR Services
Template Priority
About Cascading
Conference Templates List
Field Description Common Settings
Add Conference Template Dialog Box
RMX General Settings
Resource Management System Integration on
LPR
RMX Gathering Settings
RMX Video Quality
RMX Video Settings
Not available if Video switching or Same layout is
Not available if Presentation mode or Video switching
Telepresence mode is Yes
RMX Audio Settings
Select Layout Dialog Box on
RMX Skins
RMX Conference IVR
Field Description RMX Recording
Cisco Codian
FECC/DTMF
RMX General Settings
Field Description Common Settings
Edit Conference Template Dialog Box
4Edit Conference Template dialog box
212
Polycom, Inc 213
214
Not available if Video switching is on or Telepresence
216
Polycom, Inc 217
Field Description Cisco Codian
Select Layout Dialog Box
Conference Templates Procedures
Go to Admin Conference Manager Conference Templates
Shared Number Dialing
DMA Operations Guide Shared Number Dialing
Add Virtual Entry Queue Dialog Box
Add Direct Dial Virtual Entry Queue Dialog Box
Edit Virtual Entry Queue Dialog Box
Edit Direct Dial Virtual Entry Queue Dialog Box
DMA Operations Guide Shared Number Dialing 226
Superclustering
About Superclustering
228
DMAs
DMA Operations Guide DMAs
Following table describes the fields on
Join Supercluster Dialog Box
Supercluster Procedures
Go to Network DMAs
Actions list, click Join Supercluster
To remove a cluster from the supercluster
Actions list, select Remove from Supercluster
236
Call Server Configuration
Consequences of Enabling Maximum Security Mode on
About the Call Server Capabilities
Call Server Settings
External Gatekeeper on
By alias dial rule see The Default Dial Plan
Suggestions for Modifications on
Larger than Timeout for call forwarding when no
Answer
Domains
Authorized domains list
Dial Rules
Domain doesn’t match a Resolve to conference room
3Fields in the Dial Rules lists
Test Dial Rules Dialog Box
Sipsrbruce@10.47.7.9
Default Dial Plan and Suggestions for Modifications
Rule Effect
248
Polycom, Inc 249
Add Dial Rule Dialog Box
Field Description Dial Rule
Preliminary
Sample Preliminary and Postliminary Scripts on
7Dial rule actions
Edit Dial Rule Dialog Box
9Dial rule actions
Preliminary/Postliminary Scripting
Variable Initial value
Ms-forking
OUTPUTSIPHEADERSUser-Agent =
Someone. Not a DMA
OUTPUTSIPHEADERSSome-Custom-Header
Dial Rule Action Output SIP Headers
Script Debugging Dialog Box for Preliminaries/Postliminaries
Dialstring = sipxxx@10.33.120.58
Sample Preliminary and Postliminary Scripts
Add prefix 99 to the dial string 1234
Substitute Domain SIP
Site Based Numeric Nicknames
User = Callersitecountrycode + Callersiteareacode + user
Hunt Groups
Add Hunt Group Dialog Box
Edit Hunt Group Dialog Box
Field Description General Info
Hunt Group Members
15Edit Hunt Group dialog box
Inbound Authentication
Device Authentication
On the Inbound Authentication tab, you can
Shared Outbound Authentication
Field Description Inbound Authentication
Shared Outbound Authentication
Add Device Authentication Dialog Box
External SIP Peer Dialog Box on page 114 . If there is
Edit Device Authentication Dialog Box
Field Description Device Authentication
Registration Policy
19Fields on the Registration Policy
Registration Policy Scripting
Epdefinedincma
EPISIPV4
Epversion
Script Debugging Dialog Box for Registration Policy Scripts
Sample Registration Policy Scripts
If EPH323DIALEDDIGITSALIAS0.length!= Return Noncompliant
Polycom, Inc 275
Prefix Service
Add Simplified Isdn Gateway Dialing Prefix Dialog Box
MCU Dialog Box on
Edit Simplified Isdn Gateway Dialing Prefix Dialog Box
Dialog Box on
Edit Vertical Service Code Dialog Box
Embedded DNS
Following table describes the fields on the Embedded DNS
Callservers.example.com
Callserver-paris.callservers.example.com
History Retention Settings
Records see Registration History Report on
Conference History on
Site Topology
About Site Topology
284
Sites
Field Description Site Info
Site Information Dialog Box
Device Types
Field Description General Info General Settings
Bandwidth Settings
Add Site Dialog Box
Subnets
Isdn Number Assignment
Field Description Territory Settings
From the Endpoints page see Edit Device Dialog Box
Gateway Extension Dialing. Select this option if
Isdn Outbound Dialing
Isdn Range Assignment for gateway extension dialing method
Isdn Range Assignment for did dialing method
Routing
ALG
SIP Routing
Edit Site Dialog Box
Field Description Isdn Number Assignment
Gateway Extension Dialing . Select this option if
Field Description Isdn Outbound Dialing
Polycom, Inc 295
296
Add Subnet Dialog Box
Edit Subnet Dialog Box
Site Links
Add Site Link Dialog Box
Edit Site Link Dialog Box
Add Site-to-Site Exclusion Wizard
Site-to-Site Exclusions
Go to Network Site Topology Site-to-Site Exclusions
Territories
Add Territory Dialog Box
Column/Section Description
Territory Summary
Associated Sites pane
Associated Sites
Edit Territory Dialog Box
FieldDescription Territory Info
Network Clouds
Field Description Cloud Info
Add Network Cloud Dialog Box
Site Link dialog box see Add Site Link Dialog Box on
Edit Network Cloud Dialog Box
Site Topology Configuration Procedures
Go to Network Site Topology Sites
Go to Network Site Topology Territories
About Site Topology on
310
Users and Groups
User Roles Overview
Role Description
Adding Users Overview
Users
Following table describes the parts of the Users list
Room of the user’s. See Edit Conference Room Dialog
Add User Dialog Box
CDR
Conference Settings on
Associated Endpoints
Select to open the Select Associated Endpoints
Endpoints page see Associate User Dialog Box
Field Description Associated Roles
Conference Passcodes
Edit User Dialog Box
Polycom, Inc 321
Select Associated Endpoints Dialog Box
Field Description Conference Passcodes
Conference Rooms Dialog Box
Pool Orders on
Add Conference Room Dialog Box
Conference Settings
See Conference Settings on
Conference Template Dialog Box on
Edit Conference Room Dialog Box
Call CDRs to this conference room
System after this date
Add Dial-out Participant Dialog Box
Users Procedures
Edit Dial-out Participant Dialog Box
Go to User Users
Conference Rooms Procedures
To edit one of a user’s conference rooms
To delete one of a user’s custom conference rooms
Groups
Endpoints on
Import Enterprise Groups Dialog Box
MCU Pool Orders on
See also Users on page 314 Groups on
Edit Group Dialog Box
Conference Templates on
Enterprise Groups Procedures
Actions list, click Import Enterprise Groups
Polycom, Inc 343
Login Sessions
Change Password Dialog Box
Local Password on
346
System Management Maintenance
Management and Maintenance Overview
Administrator Responsibilities
Administrative Best Practices
Auditor Responsibilities
Recommended Regular Maintenance
Auditor Best Practices
General system health and capacity checks
Microsoft Active Directory health
Dashboard
Active Directory Integration Pane
Call Server Active Calls Pane
Call Server Registrations Pane
Cluster Info Pane
Conference Manager MCUs Pane
Conference History Max Participants Pane
Conference Manager Usage Pane
Exchange Server Integration Pane
License Status Pane
Signaling Settings Pane
Resource Management System Integration Pane
Supercluster Status Pane
User Login History Pane
Territory Status Pane
Alerts
Alert
Hhmm GMT+/-HMM
No clusters assigned to list of territories
YYYY-MM-DD Hhmm GMT+/-HMM
Active Directory Connection section
364
Polycom, Inc 365
366
Cluster cluster The server certificate has expired
Cluster cluster One or more CA certificates have expired
Cluster cluster a private network error exists on server
Cluster cluster a management network error exists on server
Polycom, Inc 371
Server server CPU utilization 50% and 75%
Polycom, Inc 373
Cluster cluster Local users differ between servers
MCU MCUname has count warnings
No territories configured to host conference rooms
System Log Files
System Logs Procedures
Actions list, click Download Active Logs
To manually roll the system logs
Troubleshooting Utilities
Ping
Traceroute
Top
Backing Up and Restoring
Go to Maintenance Troubleshooting Utilities SAR
Stats
System may delete backups to free up disk space if necessary
3Information in the Backup and Restore list
Go to Maintenance Backup and Restore
Backup and Restore Procedures
Actions list, click Download Selected
To upload a backup file
Actions list, click Restore Selected
Polycom, Inc 387
Upgrading the Software
Following table describes the parts of the Software Upgrade
Basic Upgrade Procedures
Go to Maintenance Software Upgrade
Return to Maintenance Software Upgrade
To roll back an upgrade, restoring the previous version
Polycom, Inc 393
394
Incompatible Software Version Supercluster Upgrades
Factors to Consider for an Incremental Supercluster Upgrade
Simplified Supercluster Upgrade Complete Service Outage
398
Polycom, Inc 399
400
Polycom, Inc 401
Complex Supercluster Upgrade Some Service Maintained
Adding a Second Server
Expanding an Unpatched System
Expanding a Patched System
Replacing a Failed Server
Go to Maintenance Shutdown and Restart
Shutting Down and Restarting
System Reports
Alert History
Call History
Export History
Conference History
Associated Calls
Conference Events
Property Changes
Call Detail Records CDRs
Exporting CDR Data
Call Record Layouts
VEQ
Call CDR
Conference Record Layouts
Conference Room Dialog Box on
Value from the Conference room pass-through to
See Edit User Dialog Box on
Conference Room Dialog Box on
Registration History Report
Registration History Procedures
Active Directory Integration Report
Auto-discover failed or is disabled could be
Selected on the Microsoft Active Directory Integration
Site could not be determined the system’s subnet
All Domains
Partially loaded or Unable to load see Error
Groups with Partially Loaded or No Membership Information
Orphaned Groups and Users Procedures
Orphaned Groups and Users Report
Field Description Orphaned Groups
Orphaned Users
Conference Room Errors Report
12Information in the Conference Room Errors list
Enterprise Passcode Errors Report
Exporting Conference Room Errors Data
Information in the Enterprise Passcode Errors list
Exporting Enterprise Passcode Errors Data
Network Usage Report
Exporting Network Usage Data
Following table describes the fields in the records
14 Network Usage record layout
To download network usage data
DMA Operations Guide Network Usage Report 430
Polycom DMA System Snmp Support
Snmp Overview
Snmp Versions Supported
Snmp Settings
List of Available Snmp MIBs
Name Description
System MIB on
Setting Description
See Snmp Versions Supported on page 432 for a
Notification Users
Notification Agents
Add Notification User Dialog Box
Snmp Versions Supported on
3Add Notification User dialog box
Edit Notification User Dialog Box
Add Notification Agent Dialog Box
Edit Notification Agent Dialog Box
Go to Admin Local Cluster Snmp Settings
Snmp Procedures
Go to Admin Snmp Settings Click Download MIBs
Polycom DMA System MIB
CfgProdInfoSWExtVerPlatformVersion
CfgProdInfoSWExtVerApplicationVersion
CfgServer
Polycom DMA System MIB
444
Polycom, Inc 445
446
Polycom, Inc 447
448
Polycom, Inc 449
DmaConformance
DmaConformanceGroups
TEXTUAL-CONVENTION, DisplayString, TruthValue, DateAndTime
From SNMPv2-TC
Dma MODULE-IDENTITY
201109220000Z
Polycom, Inc
Initial draft
Dma.2.1.1.1 CfgProductInfo
Dma.2
Information about the DMA product
Syntax GeneralString MAX-ACCESS read-only Status current
GeneralString
Read-only
= cfgProdInfoSWExtendedVersion
Not-accessible
= cfgNetwork
Syntax CfgInterfacesEntry
An entry in cfgInterfacesTable
Polycom, Inc 455
Site topology configuration for the call server
= cfgCsSupercluster
= cfgCsSiteTopology
Configured territories
= cfgCsTerritoriesEntry Dma.2.1.3.1.1.2.1.3
= cfgCsIntDirSvcMSActiveDirectory Dma.2.1.3.1.2.1.1.3
Address of the Exchange server
= cfgCsIntCalMSExchange
Configurations for network integrations
= cfgCsIntegrations
Polycom, Inc 461
SIP signaling configuration for the cluster
= cfgCsSignaling
Dma.2.2
Current Description Contains status data for the DMA system
Dma.2.2.1
= stIdentity
Syntax DisplayString MAX-ACCESS read-only Status current
Dma.2.2.1.2.2 StVersionTable
Sequence of StVersionEntry
Status current Description An entry in stVersionTable
Server statuses
Sequence of StNetClusterAffiliationEntry
= stNetwork
Syntax StNetPrivateInterfaceEntry MAX-ACCESS not-accessible
Dma.2.2.1.3.2 StNetPrivateInterfaceTable OBJECT-TYPE
Sequence of StNetPrivateInterfaceEntry
An entry in stNetPrivateInterfaceTable
Polycom, Inc 469
Sequence of StNetManagementInterfaceEntry
= stNetManagementInterfaceEntry
= stNetSignalingInterfaceEntry Dma.2.2.1.3.4.1.3
Sequence of StNetSignalingInterfaceEntry
DisplayString
Sequence of StRsrcCPUUsageEntry
Sequence of StRsrcMemoryUsageEntry
Memory usage information for the servers
= stResources
= stRsrcMemoryUsageTable
StRsrcMemoryUsageEntry = Sequence
StRsrcMemUsageIndex Unsigned32 StRsrcMemUsageHostName
Swap
Sequence of StRsrcSwapSpaceEntry
Status current Description stRsrcSpaceTable index
Syntax StRsrcDiskSpaceEntry MAX-ACCESS not-accessible
= stRsrcSwapSpaceEntry
Sequence of StRsrcDiskSpaceEntry
Disk
Syntax StRsrcLogSpaceEntry MAX-ACCESS not-accessible
= stRsrcDiskSpaceEntry
Sequence of StRsrcLogSpaceEntry
An entry in stRsrcLogSpaceTable
Polycom, Inc 479
Syntax StMCUStatusEntry MAX-ACCESS not-accessible
Sequence of StMCUStatusEntry
= stMCUs
An entry in stMCUStatusTable
StMCUStServiceStatus Integer
StMCUStIVRAvailable TruthValue
Sequence of StMCUVideoPortUsageEntry
= stMCUVideoPortUsageEntry Dma.2.2.2.1.3.1.3
Sequence of StMCUVoicePortUsageEntry
484
Sequence of StMCUPCConnectionStatusEntry
= stMCUVoicePortUsageEntry
= stMCUsPerCluster
StMCUPCConnStConnectionStatus Integer
Sequence of StMCUPCReliabilityStatsEntry
= stMCUPCReliabilityStatsEntry
Hundredths
Divided
Value
Sequence of StClustersEntry
Dma.2.2.3.2.1.3 StClClusterStatus OBJECT-TYPE
Syntax StLicensesEntry MAX-ACCESS not-accessible
Sequence of StLicensesEntry
Call server status shared across the supercluster
= stCallserver
Sequence of StCsConfMgrTerritoriesEntry
Failed5, outdated6, failedNoSuchEnterpriseUser7
Status of Active Directory caching
= stCsIntDirSvcMSActiveDirectory
Name of cluster performing AD caching
True if Exchange integration is enabled
Syntax DateAndTime MAX-ACCESS read-only Status current
TruthValue
Status for site topology service integration
= stCsIntCalMSExchange
= stCsIntegrations
Number of territories provided by the CMA system
True if Juniper SRC integration is enabled
= stCsIntNetBWMgmtJuniperSRC
Sequence of StCsConfMgrMCUsEntry
= stCsConfMgrMCUs
Dma.2.2.4.2.1.2.1.1 StCsCMMCUIndex
StCsConfMgrMCUsTable index
Syntax Unsigned32 MAX-ACCESS read-only Status current
Dma.2.3.1.1.2 UseCHMaxPartsLast60MinutesTable OBJECT-TYPE
Sequence of UseCHMaxPartsLast60MinutesEntry
One-minute intervals
= useCHMaxPartsLast60MinutesTable
UseCHMaxPartsLast60MinutesEntry = Sequence
Sequence of UseCHMaxPartsLast24HoursEntry
One-hour intervals
An entry in useCHMaxPartsLast24HoursTable
UseCHMaxParts24HrMaxAdHocCalls Unsigned32
UseCHMaxParts24HrMaxPCOCalls Unsigned32
Dma.2.3.1.1.6 UseCHMaxPartsLast180DaysTable OBJECT-TYPE
Syntax UseCHMaxPartsLast180DaysEntry
= useCHMaxPartsLast180DaysTable
UseCHMaxParts180DaysTimestamp DateAndTime
= useCHMaxPartsLast180DaysEntry
Sequence of UseConfMgrUsageEntry
Dma.2.3.2.1.2 UseConfMgrUsageTable OBJECT-TYPE
= useCurrentConfsConfManagerUsage
Polycom, Inc 505
Sequence of UseDevRegistrationsEntry
= useDevRegistrations
Device registrations per cluster
Number of endpoints with an inactive registration status
= useDevRegistrationsEntry
Syntax AlActiveAlertsEntry MAX-ACCESS not-accessible
= alActiveAlertsTable
Polycom, Inc 509
Text
= alActiveAlertsEntry
Dma.2.5 DmaNotifications OBJECT-IDENTITY Status current
Warn1, severe2, critical3
Accessible-for-notify
NtfObjAlertID NtfObjAlertTimestamp NtfObjAlertCode
512
Polycom, Inc 513
514
Polycom, Inc 515
NtfObjAlertID NtfObjAlertTimestamp
Polycom, Inc 517
518
Polycom, Inc 519
520
Polycom, Inc 521
522
Polycom, Inc 523
524
Polycom, Inc 525
526
Polycom, Inc 527
DMA Conformance
CfgCallserver CfgCsSupercluster
CfgCsCluster CfgCsSignaling CfgCsSgnlH323
StNetSignalingInterfaceTable StNetSignalingInterfaceEntry
DmaConformanceStatus OBJECT-GROUP Objects DmaStatus
StIdentity StHardwareInfoTable
StVersionTable StVersionEntry StVerIndex
StRsrcSwapSpaceTable StRsrcSwapSpaceEntry StRsrcSwapIndex
StRsrcDiskSpaceTable StRsrcDiskSpaceEntry StRsrcDiskIndex
StClustersTable StClustersEntry
StCallserver StCsSupercluster
Description Conformance group for dmaStatus
= dmaConformanceGroups
534
1.4 DmaConformanceAlerts OBJECT-GROUP
Description Conformance group for dmaUsage
Description Conformance group for dmaAlerts
536
Module POLYCOM-DMA-MIB MANDATORY-GROUPS
= dmaMonitoring1
538
Index
540
Polycom, Inc Index
See MCU pool orders
543
Xmpp
545
Working in system Certificates 35 Xmpp signaling