Corporate Headquarters
Copyright 2002, Cisco Systems, Inc All rights reserved
N T E N T S
Iii
Setting Trap Notification
Assigning an Auto-Managed Configuration
Displaying an EAP Authentication Report
Displaying a Server Response Time Graph
Vii
Command History Feature B-3
Viii
Privilege Level 15 Commands B-17
Show ipchains show hosts B-61show maillog
Show tech B-68
Xii
Audience
Conventions
Convention
Boldface font
Related Documentation
Option Network Preferences
Paper Documentation
Xiv
World Wide Web
Obtaining Documentation
Online Documentation
Obtaining Technical Assistance
Ordering Documentation
Documentation Feedback
Cisco documentation is available in these ways 800 553-NETS
Technical Assistance Center
Cisco.com
Xvii
Cisco TAC Escalation Center
Cisco TAC Web Site
Xviii
Xix
Page
Overview of the Wireless LAN Solution Engine
A P T E R
Understanding the Wlse User Interface
Wlse Dashboard
Tabs and Subtabs
Main Tab Subtabs
Administrative Tasks
Buttons
Performing
Devices under management, run immediate inventories, view
Device Name and IP Address Display
Time Display
CiscoWorks 1105 Wireless LAN Solution Engine
Procedure
Logging In and Out
Getting Started with Device Management
Task Description and References
Managing Devices, page 6-2. After moving devices to
Administering Users,
Inventories,
Displaying Faults
Settings, page 2-20 to set policies
Devices Severity
Field
Description
State Name/IP
Click Apply. The following table appears
Column
Viewing Fault Details
Managing Profiles, Notification Settings,
Fault details for
Related Topics
Family Product Type IfIndex
Conditions Description
Column Description
See Time Display,
Fault History
Managing Profiles
Creating a Profile
Copying a Profile
Assigning a Profile to a Device, Viewing Devices,
Use this option to create a profile
Renaming a Profile
Editing a Profile
Use this option to rename a profile
Use this option to edit a profile
Assigning a Profile to a Device
Deleting a Profile
Use this option to delete a profile
Viewing Devices
Profile Choices
Specifying Security Policies
Field Description
Click Add to add the Ssid to the list, then go to Step
Complete the following
Step
Go to Step Complete the following
Specifying Fault Thresholds
Setting Access Point Fault Thresholds
Enable Poll Interval Settings Overloaded
Continue to Step
Setting Switch Fault Thresholds
Degraded
Go to step Step
To set the new entries
Setting Router Fault Thresholds
Setting Server Response Time
Notification Settings
Setting Trap Notification
Before You Begin
Setting Syslog Notification
Setting Syslog Notification, Emailing Faults,
Emailing Faults
To save your settings
Setting Trap Notification, Emailing Faults,
Attribute Description
Procedure
Setting Trap Notification, Setting Syslog Notification,
Fault Monitoring Notification Settings
Configuring Devices
Using the Templates
Related Topic
Template Choices
Template Categories
Naming the Template
Using Express Template
See Naming Guidelines, page A-1
Express Template Settings
Configuring Devices
Field Description
LAN
Setting Up Association
Finish to save the template. See Finishing the Template,
Defining Spanning Tree Protocol
This option is used for only bridges
Disable-If you do not want STP enabled
Enable-Use this setting to enable STP on
Bridge
Configuring Devices
Defining Address Filters
Field Description
Creating New Ethertype Filters Procedure
Defining Ethertype Filters
Creating New Ethertype Filters Settings
Deleting Ethertype Filters Procedure
Creating Special Cases Procedure
Configuring Devices
Deleting Special Cases Procedure
Defining IP Protocol Filters
Using this option you can also
Creating New IP Protocol Filters Procedure
Deleting IP Protocol Filters Procedure
IP Protocol Filters Special Cases Settings
Field Description
Defining IP Port Filters
Creating New Port Filters Procedure
To create and enable port filters, enter the following
Deleting Port Filters Procedure
IP Port Filters Special Cases Settings
Configuring Devices
Configuring Policy Groups
Adding or Deleting a New Policy Group
To add a new policy group, enter the following
Filters
IP Protocol
Protocol Filters
Deleting an Existing Policy Group from a Device
Configuring VLANs
Enter the following information
Setting on the switch
Add a new VLAN-SeeAdding a New VLAN,
Created using Association Policy Groups
Adding a New Vlan
To add a new VLAN, enter the following
Enter the identification number of the Vlan
Field Description
Vlan
Configuring Quality of Service
Deleting an Existing Vlan Procedure
Quality of Service Settings
Configuring Service Sets
This option allows you to define service sets
Add a new Service Set-SeeAdding a New Service Set,
Adding a New Service Set Procedure
Using Association Policy Groups
Association VLANs
Field Description
Finish to save the template. See Finishing the Template,
Deleting an Existing Service Set Procedure
Defining Advanced Associations
10 Advanced Association Settings
SystemWarning-Indicates that an error or
ProtocolWarning-Indicates that an error or
PortWarning-Indicates that an error or failure
ExternalWarning-Indicates that an error or
Field Description
Finish to save the template. See Finishing the Template,
Lists the port’s 802.11 radio drivers association
Configuring Port Assignments
Identifier
Configuring Dscp to CoS
Use this option to configure the device’s Ethernet port
Configuring the Ethernet Port
Identifying the Ethernet Port
Setting Up Ethernet Filters
Enter the following information to identify the port
Filters you created using Association Ethertype Filters
Filters you created using Association IP Port Filters
Setting Up Hardware
Defining the Ethernet Advanced Settings
Ssid
Disallowed under Association Address Filters
Allowed under Association Address Filters
Set as disallowed under Association Address
Use this option to configure the device’s 11b radio
Configuring the 11b Radio
Identifying the 11b Radio Port
Procedure
Ethernet Identification ,
Primary Port? From the list, select one of the following
Selected value is displayed
Association Ethertype Filters
Setting Up 11b Radio Filters
Association IP Protocol Filters
Defining the 11b Radio Hardware Settings
IP Port Receive Transmit
18 11b Radio Hardware Settings
Field Description
Configuring Devices
Field Description
Field Description
Defining the 11b Radio Advanced Settings
Disallowed-The access point discards
Association Address Filters
All traffic except packets sent to the MAC
Addresses set as allowed under
Field Description
None-Does not enable MIC
NMH-Enables MIC Message Integrity
Check, a security feature that protects
This setting is valid
Field Description
Defining the 11b Radio Searched Channels Settings
20 11b Radio Searched Channels Settings
Use this option to configure the device’s 11a radio
Configuring the 11a Radio
Identifying the 11a Radio Port
Ethernet Identification,
Setting Up 11a Radio Filters
Ethertype Receive Transmit
Defining the 11a Radio Hardware Settings
Right pane
23 11a Radio Hardware Settings
78-14947-01
Configuring Devices
Field Description
Defining the 11a Radio Advanced Settings
24 11a Radio Advanced Settings
LAN
WEP
Field Description
Field Description
Finish to save the template. See Finishing the Template,
Defining the 11a Radio Searched Channels Settings
Defining the 11a Radio Data Encryption Settings
26 11a Radio Data Encryption Settings
Configuring Devices
Defining the Security Settings
Setting Local Admin Access
Use this option to configure the device’s security settings
Use this option to enable or disable local admin access
Adding Users Procedure
Add Users-SeeAdding Users, Delete Users-SeeDeleting Users,
Setting Local AP/Client Security
Deleting Users
28 Local AP /Client Security Settings
Field Description
Setting Server-Based Security
Use this option to set up server-based security
Procedure
29 Server-Based Security Settings
100
101
Configuring Services
102
Configuring Start-Up Settings
103
104
Field Description
105
106
Configuring Console/Telnet Settings
107
ANSI-Use this setting to offer graphic
Features such as reverse video buttons
Underlined links
108
Configuring Hot Standby Settings
109
110
Configuring Routing Settings
111
Configuring CDP Settings
112
Configuring DNS Settings
113
Configuring FTP Settings
Disable-Use this option if you network
Select Services FTP. The Services FTP dialog box appears
Does not use DNS
FTP
115
Configuring Http Settings
116
Configuring Snmp Settings
117
Configuring Sntp Settings
118
Configuring Accounting Settings
119
120
121
122
123
Configuring Event Handling
Configuring Events
124
125
126
127
128
Configuring Event Notification
129
Configuring Custom Values
130
Previewing the Template
Key Value
Click Finish. See Finishing the Template,
131
Use this option to create a configuration template
Creating a Template
Finishing the Template
132
Click Edit. See Editing a Template,
Copying a Template
133
Use this option to edit a configuration template
Use this option to delete a configuration template
Editing a Template
Deleting a Template
Importing a Template
Click Import. The Import Template window appears
Import
135
136
Exporting a Template
Managing Configuration Jobs
137
Using the Templates,
Job Choices
Naming the Job
Deleting a Job, Copying a Job, Viewing Job Run Details,
Selecting Devices
Job Name Enter a name for the job
Description Enter a description of the job
139
Click Select Template. The Select Template window appears
Selecting a Template
140
141
Scheduling a Job
142
Finishing the Job
143
Creating a Configuration Job
Viewing Configuration Job Status
Viewing the Job, Filtering a Job, Editing a Job,
144
Viewing the Job
145
You can stop a running job by clicking Stop Job
Running
146
Filtering a Job
You can do the following
Refresh the screen-Click Refresh
147
Editing a Job
Deleting a Job
Copying a Job
Click Delete Job
Viewing Job Run Details
149
Job Runs Details table displays the following information
Viewing the Job Run Details Table
150
Assigning a Startup Configuration
Automating Configurations
151
Configuration Template dialog box appears
152
Creating a Startup Configuration Template
Click Save to save the template
Click Delete to delete the template
153
Tasks Template Choice
Assigning an Auto-Managed Configuration
154
Discover Device Credentials Http User/Password
155
Assigning Auto-Managed Configurations
156
Select Configure Auto Update Auto-Managed Configuration
Using Auto-Managed Options
157
158
Updating Device Firmware
Managing Firmware Images
Viewing Images on the Wlse
Importing images-SeeImporting Images,
Managing Firmware Jobs,
Editing Image Details on the WLSE,
When you finish editing, click Save
Editing Image Details on the Wlse
Image Details window opens
Deleting Images from the WLSE,
Deleting Images from the Wlse
Importing Images
Importing Images from the Client System Desktop to the Wlse
Details on the WLSE,
Window is displayed. Complete the following
Updating Device Firmware Managing Firmware Images
Using a Remote Tftp Server for Image Upload
Managing Firmware Jobs
Managing Firmware Images,
Click Job Name. The Job Name dialog box appears
Selecting the Image
Job Name Enter a name for the job. For guidelines on naming
Jobs, see Naming Guidelines, page A-1
A-1
Selecting Devices
Scheduling the Job
Email settings section
Remote server settings section
Validate and Save section
Job Save Summary Window
Job Validation Summary Window Details
Using the Job Functions
Creating a Firmware Job
Creating a Firmware Job,
Viewing Jobs by Job State
Job Name Job name
Field Description
Filtering Jobs
Click OK in the popup windows
Use this option to view details about a job
Job Run Details Table
Updating Device Firmware Managing Firmware Jobs
Using Reports
Using the Device Center
For routers
Viewing the Fault Summary Report
Following table is displayed for the device’s fault summary
Details,
For more information, see Time Display
Viewing Device History
Viewing Config History
Following table is displayed for the device’s history
Viewing Firmware History
Job Name Job Type
Displaying Wireless Client Reports
Displaying a Client Detail Report
Address or name
Click Search. a list appears in the left pane
Chose name, names are listed
To export the report, click Export. See Exporting a Report,
Displaying a Client Statistics Report
Displaying a Client Historical Association Report
Report,
Administration Discover Tasks History
Inventory
Displaying Current Reports
Individual Access Point and Bridge Reports
Group Reports
Individual Switch Reports
Displaying a Group Report
Individual Router Reports
Individual Server Reports
Displaying an EAP Authentication
Fault Summary Report,
Detailed Report,
Time the access point’s state last
Displaying a Group Security Report
Fault Summary-Viewing the Fault
Authentication Report,
Summary Report,
Report-Displaying an EAP
EAP Authentication Report,
Displaying a Group Ssid Report
Group Policy Report,
Displaying a Group Vlan Report
Vlan Name Name of the Vlan
Column Description
Displaying a Per Vlan Client Report
Displaying a Group Policy Report
Filters Report,
Report-SeeDisplaying an AP Ethertype Protocol
Report-SeeDisplaying an AP IP Protocol Filters
Report-See Displaying an AP IP Protocol Filters Report,
Displaying an AP IP Port Filters Report,
Displaying an AP Summary Report
Current Client Association Report
Authentication Report are also displayed
Displaying a Detailed Report
From the Report Name list, select Detailed Report
Displayed, one for each interface
Unique identifier the client device uses to
Column Description
Displaying a Current Client Association Report
Displaying an EAP Authentication Report
From the Report Name list, select EAP Authentication Report
Displaying an AP Ethertype Protocol Filters Report
Displaying an AP IP Protocol Filters Report
From the Report Name list, select AP IP Protocol Filters
Displaying an AP IP Port Filters Report
Displaying an AP Policy Report
Displaying an AP Ethertype Protocol Filters Report
From the Report Name list, select AP Policy Report
Displaying an AP IP Protocol Filters Report,
Displaying an AP Qbss QoS Report
An AP IP Port Filters Report,
22 AP Qbss QoS Report
Displaying an AP Ssid Report
Unique identifier the client device uses to associate
Vlan identification number
Vlan Name Vlan name
Policy Report,
Displaying an AP Vlan Report
24 AP Vlan Report
25 Per Vlan Client Report
Displaying a Switch Summary Report
From the Report Name list, select Switch Summary Report
Displaying an AP and Bridge Connected to Switch Report
Bridge Connected to Switch Report
Displaying a Router Summary Report
Displaying an AP and Bridge Connected to Router Report
From the Report Name list, select Router Summary Report
Displaying a Server Summary Report
Displaying Trends
Performance Report RF Utilization,
Group Performance Report Ethernet Utilization,
Displaying a Group Performance Report RF Utilization
Servers
31 Group Performance Report RF Utilization
Displaying a Group Performance Report Ethernet Utilization
Unique identifier the client device uses
Displaying a Top N Number of Associations Report
Channel Number Channel being used
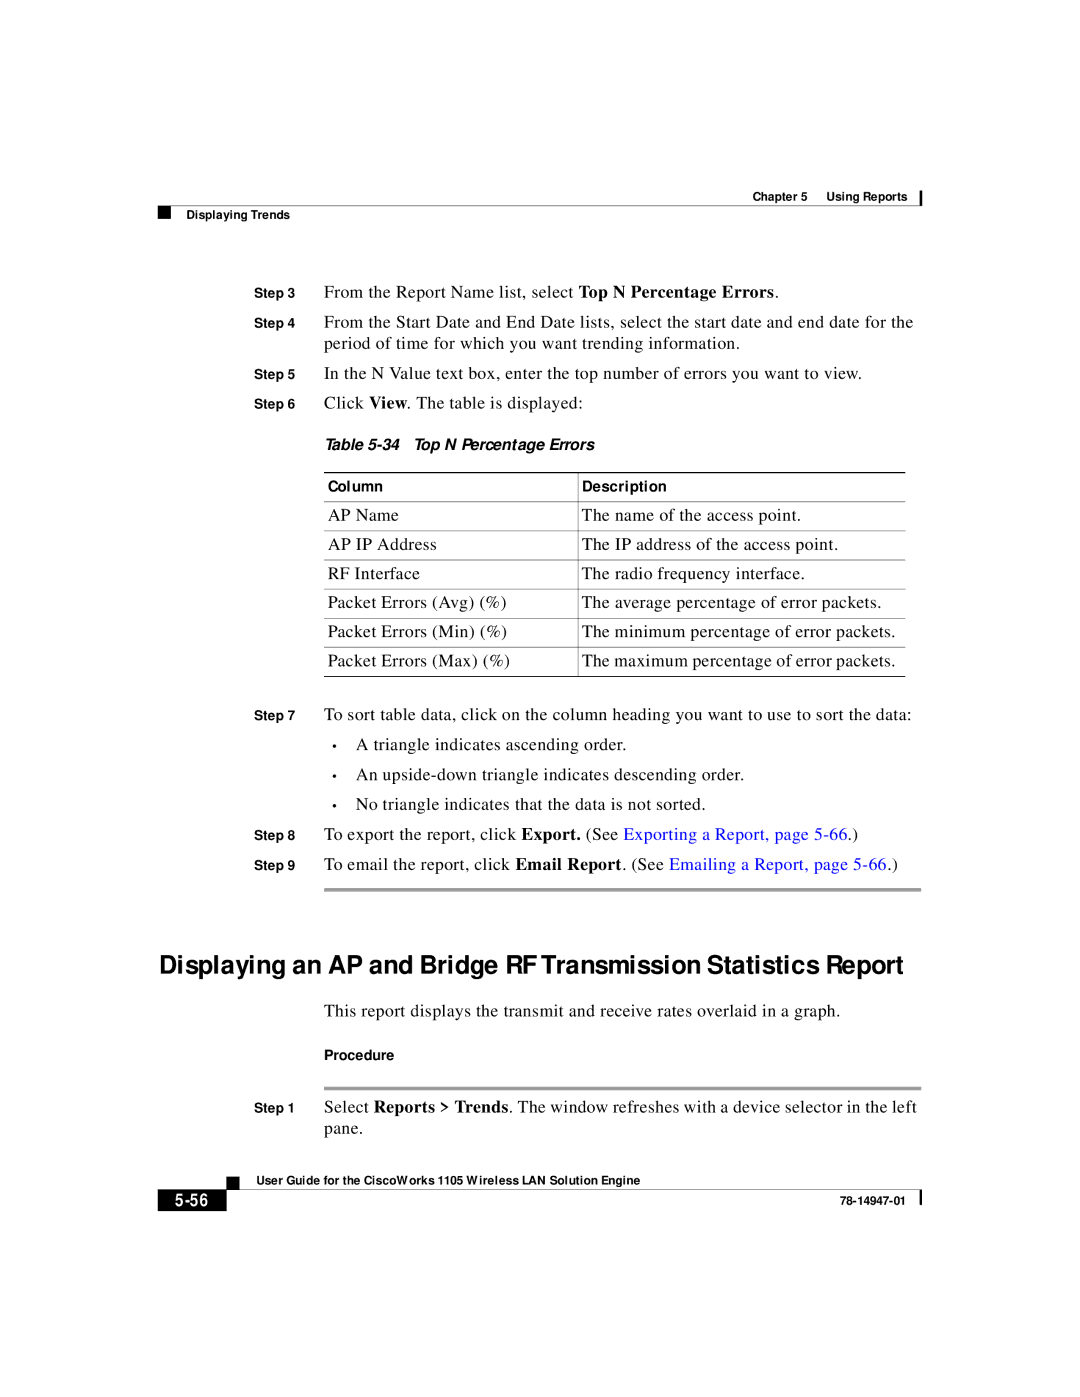
Displaying a Top N Percentage Errors
From the Report Name list, select Top N Percentage Errors
Period of time for which you want trending information
Click View. a graph is displayed
36 AP and Bridge Ethernet Transmission Statistics
Displaying Trends
Displaying an AP and Bridge Performance Graph
Displaying an AP and Bridge Performance Tabular
Displaying Top N Busiest Clients
View. The right pane refreshes
Period of list, select the number of days
Click View. The report is displayed
From the Report Name list, select Top N Busiest Clients
Displaying Top N Client Error Rate
Displaying a Server Response Time Graph
Emailing a Report
Exporting a Report
Click View. The following report displays
To cancel the email, click Cancel
Mailroute by selecting Administration Appliance Configure
To send the email immediately, click Send Now
Scheduling Email Jobs
Viewing Email Job Details
Report Properties Column Description
Subject Format Body
Email Properties Column
Schedule Properties Column Description
Performing Administrative Tasks
Using Discovery and Managing Devices
Managing Devices
Manage Devices
Device Details Pane
View Device Management History
Specifying Device Credentials
Select Administration Discover Device Credentials Snmp
Specify Community Strings
Variable Description
Community String Guidelines,
Specify the Http Username and Password
Community String Guidelines
Managing Device Discovery
Overview Discovery, Set Up Devices,
Overview Discovery
Set Up Devices
Set Up Access Points and Bridges
Tasks Procedure
Importing Devices, Managing Devices,
Add New User. The User
Password,
Specify the Http Username
You can use the same Click User Information then click
User that you created
Set Up Routers and Switches
Task Procedure
Set Up AAA Servers
Contact command
Location command
Contact contact command
Wlse
Enable Discovery Options
Enabled? Affect on Display
Set Up Discovery Filters
Manage Devices,
Include Rules Exclude Rules Defined? Result
Schedule Discovery
All devices are discovered
Procedure
Select Administration Discover Discover Run Discovery Now.
Run Discovery Now
Specifying Device Credentials,
Run Discovery Now Seeds dialog box appears
Related Topics
Running Inventories
About Scheduled Inventories
Viewing Inventory and Discovery Task History,
Discovery Task History,
Immediate Inventory of Selected Devices
Immediate Inventory of All Devices
Viewing Inventory and Discovery Task History
Name Type of Job
Importing Devices
From a file see Import Devices from a File,
Import Devices from a File
Import Devices from CiscoWorks2000
Portportnumber
Exporting Devices
Import Devices from a File, Schedule Discovery,
Type Information Description
Serveripaddress on portportnumber
Manage Leap Servers
Adding, Modifying and Deleting AAA Servers
To add, modify or delete a Leap server
To add a Leap server
Text Box Description
Manage Radius Servers
Manage EAP-MD5 Servers
Overview Groups
Managing Groups
Overview Groups, Creating, Editing, and Deleting Groups,
System-Defined Groups
Creating, Editing, and Deleting Groups
Add a Group
User-Defined Groups
Add a Group, Edit a Group, Delete a Group,
Creating a New Group
Naming Guidelines, page A-1
Box optional
Copying an Existing Group
Your new group will be added to the Subgroup Of list
Edit a Group
Edit a Group, Delete a Group, Overview Groups,
Delete a Group
Add a Group, Delete a Group, Overview Groups,
Managing the Appliance
Overview Groups, Edit a Group, Add a Group,
Viewing Wlse Status
Viewing Log File Reports
Log Files Displayed
Log File Content
Wlse maintains the following log files
Managing the Software
Restarting the Wireless LAN Solution Engine
Managing Device Discovery, Running Inventories,
Viewing Software Status
Defining the Repository
To define or redefine the repository, complete the following
Repository source ftp//hostname/path
Creating a Local Repository
Find the software you want on the FTP site
Repository add package
Creating a Remote Repository
Creating a Local Repository,
Installing Software Updates
Browsing the Repository
Installing Software Updates, Managing the Software,
Viewing Software Update History
Software Update History window displays the following
Installation
Overview Security
Managing Security
Overview Authentication Modules
Radius MS NT Domain
Selecting an Authentication Module
Selecting an Authentication Module, Administering Users,
Select Administration Appliance Security SSL HTTPS. The SSL
Managing SSL Https
Overview Security,
Https dialog box appears
Disabling or Enabling Telnet and Selecting SSH
# firewall eth0
Select Administration Appliance Security Last 10 Logins
Viewing the Last 10 Logged-On Users
Specifying the Backup Location
Backing Up and Restoring Data
Select Start Settings Control Panel Add/Remove Programs
Select Administration Appliance Backup and Restore Backup
Click Test Click OK
Select Administration Appliance Backup and Restore Restore
Backing Up Data
Backing Up Data, Specifying the Backup Location,
Using Diagnostics
Restoring Data
Viewing and Creating a Self-Test Report
Viewing and Creating a Status Report
Viewing and Creating a Self-Test Report, Viewing Processes,
Viewing Processes
Viewing and Creating a Status Report, Viewing Processes,
Report displays the following
Processes displayed, see Processes Displayed,
Return code represents normal program operation. Any
Processes Displayed
Daemon Information
Process Name Description
Daemon Information dialog box displays the following
Setting the Current Time and Date on the Wlse
Setting Up the Splash Screen Message
System Log
To set the UTC time, use the following CLI command
Select Administration Appliance TIME/NTP/NAME
Specifying NTP Time Servers
Clock set hhmmss month day year
Specifying Name Servers
Select Administration Appliance Configure Mailroute
Specifying an Smtp Mail Server
Using Connectivity Tools
Managing System Parameters
Parameter Description
Inventory Performance Attributes
Polling Interval
Inventory Performance Attributes Polling
Shown in Configure Jobs, Firmware
Jobs, and Reports Scheduled Email Jobs
Managing Roles
Administering Users
Modifying Your Profile,
Naming Guidelines, page A-1 Managing Users,
Managing Users
Add Users
Use this option to
Add Users, Modify Users, Delete Users,
Modify Users
To modify a user
Level, see the User Guide for the CiscoWorks
Wireless LAN Solution Engine -From the online help
Naming Guidelines, page A-1 Managing Roles,
Use the My Profile tab to change your password
Select Administration My Profile Change password
Modifying Your Profile
Delete Users
Linking to a CiscoWorks2000 Server
78-14947-01
Frequently Asked Questions
Frequently Asked Questions
Troubleshooting
Faults, Configure, Firmware, Reports, Administration,
Faults
Feature Symptom Probable Cause Possible Solution
Configure
Configure
See Set Up Devices
Configure Jobs
Administration Discover
Http User/Password
Http credentials
Device Credentials
Access point or bridge
Access point or bridge has
Have firmware rights
Community string on
Selecting Administration
Appliance Status View
Check if the Job Run Detail
Job Run Log to identify
Select Administration
Enter services stop
Enter services start
Credentials Snmp
Firmware Jobs
Firmware
Firmware Jobs Create
Reports
Reports
Log File
Click jobvm.log
Enter services stop to
Enter services start to
Time, select Administration
Wireless Clients
Administration
Enter services stop to stop
Administration Appliance
Discover Schedule Discovery or
Discovered in Administration
Run Discovery Now. See Managing
Authentication
Admin
User Admin
Security
Name and Description Allowable Characters
Character Description Example
Type Rules
Command Reference
Using the CLI
Command Privileges
Checking Command Syntax
CLI Conventions
Command History Feature
Help for CLI Commands
Command Summary
Debugs and tests email settings Mail section on page B-34
Configures an Ethernet interface Interface section on B-30
151 Reboots the system Reload section on page B-39
Wireless LAN Solution Engine’s B-44 Local repository
Lists, starts, or stops management Services section on B-46
Configuration On page B-50
Reinitializes the database Reinitdb section on B-40
Engine’s Web access log On page B-57
Displays the Wireless LAN Solution Show weberrorlog section
Engine’s Web error log On page B-58
Displays the Wireless LAN Solution Show websslaccesslog
Displays the Wireless LAN Solution Show snmp-server section
Engine’s Snmp configuration On page B-66
B-66
Displays syslog information Show syslog section on B-67
Command Description Conventions
Configures an snmp agent Snmp-server section on B-71
Configures Telnet access Telnetenable section on B-73
Telnets to an external host Telnet section on page B-72
Privilege Level 0 Commands
Exit
Ping
Syntax Description
Usage Guidelines
Show clock
Show clock
Related Commands
Show domain-name
Clock Ntp server
Show domain-name
Show interfaces
Show process
Show interfaces
Interface
Displays command output one screen at a time. Press
Exit paged output and return to the command prompt
Show version
Show version
Traceroute
Ping
Traceroute -m 20 -w 10 cisco.com
Privilege Level 15 Commands
Auth
Backup
Backup test
Backupconfig Listbackup Restore Show backupconfig
Test
Backupconfig
Backupconfig hostname username password directory
No backupconfig
Backup Listbackup Restore
Timer
Cdp
Run
Holdtime
Clock
Set
Ntp server Show clock
This command sets the date and time
Clock set 160000 dec 11
Erase config
Erase config
This command erases the system configuration
Erase config
Examples
Firewall
Firewall eth 0-5public private icmp telnet ssh snmp https
Gethostbyname
Hostname
Gethostbyname host
Hostname name
Import
No import host hostname ipaddress hosts
Host
Hosts
Install configure
Install configure URL URL Value default save
Default
No import hosts
Install list
Install list all full page updates
Updates
All
Install update
Install update package name
Following command installs the update EX-2.0
Install update EX-2.0
Default
Interface
This command disables the Ethernet 1 interface
Ip domain-name
Ip domain-name name no ip domain-name name
Name Domain name e.g. cisco.com
Ip name-server
Ip name-server
Ip name-server ip-address No ip name-server ip-address
Ip-address Name server IP address maximum
Listbackup
Listbackup
Ip domain-name
Ip name-server
Backup Backupconfig Restore Show backupconfig
Mail
Mail to user@host debug
User@host
Following command clears the WLSE’s email log
Mailcntrl clear
Mailcntrl list
Mailcntrl clear log sendqueue userqueue
Mailroute
Nslookup
Mailroute hostname ip-address
Nslookup dns-name ip-address
Ntp server ip-address No ntp server ip-address
Ntp server
Nslookup hostname
This command configures the system to use an NTP server
No ntp server ip-address
Ntp server ip-address
Ntp server
Reload
Clock
Reload
Shutdown
Reinitdb
Repository
Reinitdb
Repository source URL
Repository add
Repository source ftp//209.165.200.224
Repository delete package all
Repository delete
Package
Repository list
Repository list local remote detail
Remote
Detail
Following command stops the local repository
Repository server
Repository server stop start status
Repository list local detail
Restore
Releated Commands
Restore restore name
Backup Backupconfig Listbackup Show backupconfig
Services
Services command Services status start stop
Route
Netmask
This command stops management services
This command starts management services
This command shows services status
# services status
Show anilog
Show anilog page include MatchString1 MatchString2
Include
Matchstring1
Show auth-cli
Show auth-http
Show auth-cli
Show auth-http
Show backupconfig
Backup Backupconfig Listbackup Restore
Show backupconfig
Show auth-http
Show bootlog
Show bootlog
Displays command output one screen at a time. Press
Exit paged output and return to the command prompt
Show cdp neighbor
Show cdp run
Reload Clock
Show cdp neighbor
This command displays the CDP configuration
Show collectorlog
Show collectorlog page include matchstring1 matchstring2
Show cdp run
Show config
Show config
This command displays the system configuration
Show daemonslog page include matchstring1 matchstring2
Show daemonslog
Show daemonslog
Show dmgtdlog page include matchstring1 matchstring2
Show dmgtdlog
Show dmgtdlog
Show webaccesslog page include matchstring1 matchstring2
Show webaccesslog
Show webaccesslog
Show weberrorlog
Show weberrorlog page include matchstring1 matchstring2
Show websslaccesslog
Show websslaccesslog page include matchstring1 matchstring2
Show import
Show import hosts
Show install logs
This command displays the imported host file
Show install logs short long
Show ipchains
Show hosts
Show hosts
Show ipchains eth0
Show hosts
Show proc command
Show maillog
Show proc
Show maillog page include matchstring1 matchstring2
Displays command output one screen at a time
Show repository status access-log
Access-log
Show repository
This command displays the currently configured routes
Show route
Show securitylog
Show route
Show securitylog
This command displays the type of SSH that is enabled
Show snmp-server
Show ssh-version
Show snmp-server
Related Command
To display syslog information, use the show syslog command
This command displays syslog information
Show syslog
Show telnetenable
Telnetenable command Show telnetenable
Show tech
Show tech
Following command shows if Telnet is enabled or disabled
Show telnetenable
Show tomcatlog
Show tomcatlog page include matchstring1 matchstring2
Shutdown
This command shuts down the system
Shutdown
Snmp-server
Ssh
Community
Location
Ssh1 Enables SSH Ssh2 Both Enables both SSH 1 and SSH2
Ssh-version
Telnet
Ssh-version ssh1 ssh2 both
Telnetenable
Telnetenable enable ip-addresses domains disable status
Enable
Disable
Username
Maintenance Image Commands
This command removes the user account
Username user1 password password1 privilege
No username user1
To check and repair the filesystem, use the fsck command
Following command checks and repairs the filesystem
Fsck
Fsck
See also EAP-MD5 server , Leap server , and Radius
See wireless bridge
GL-1
Need them
Lower-layer protocol to treat its messages
GL-2
Group of related faults
See also AAA
Servers to transfer files, such as text and graphic files
Secure Http with SSL secure socket layer. See also SSL
Media Interface Connector. Fddi de facto standard connector
May still be used in older wireless networks
See also AAA and WEP keys
GL-4
Reflects their transmission quality and service availability
GL-5
Up to 32 characters long
Including passwords
GL-6
Called Greenwich Mean Time GMT and Zulu time
GL-7
WEP keys
Configured as an access point
GL-8
Numerics
IN-1
IN-2
IN-3
CLI
IN-4
IN-5
CLI B-2
IN-6
IN-7
IN-8
IN-9
GUI
IN-10
IN-11
IN-12
IN-13
IN-14
IN-15
IN-16
SSL
IN-17
IN-18
IN-19
IN-20