Scaling the Axes
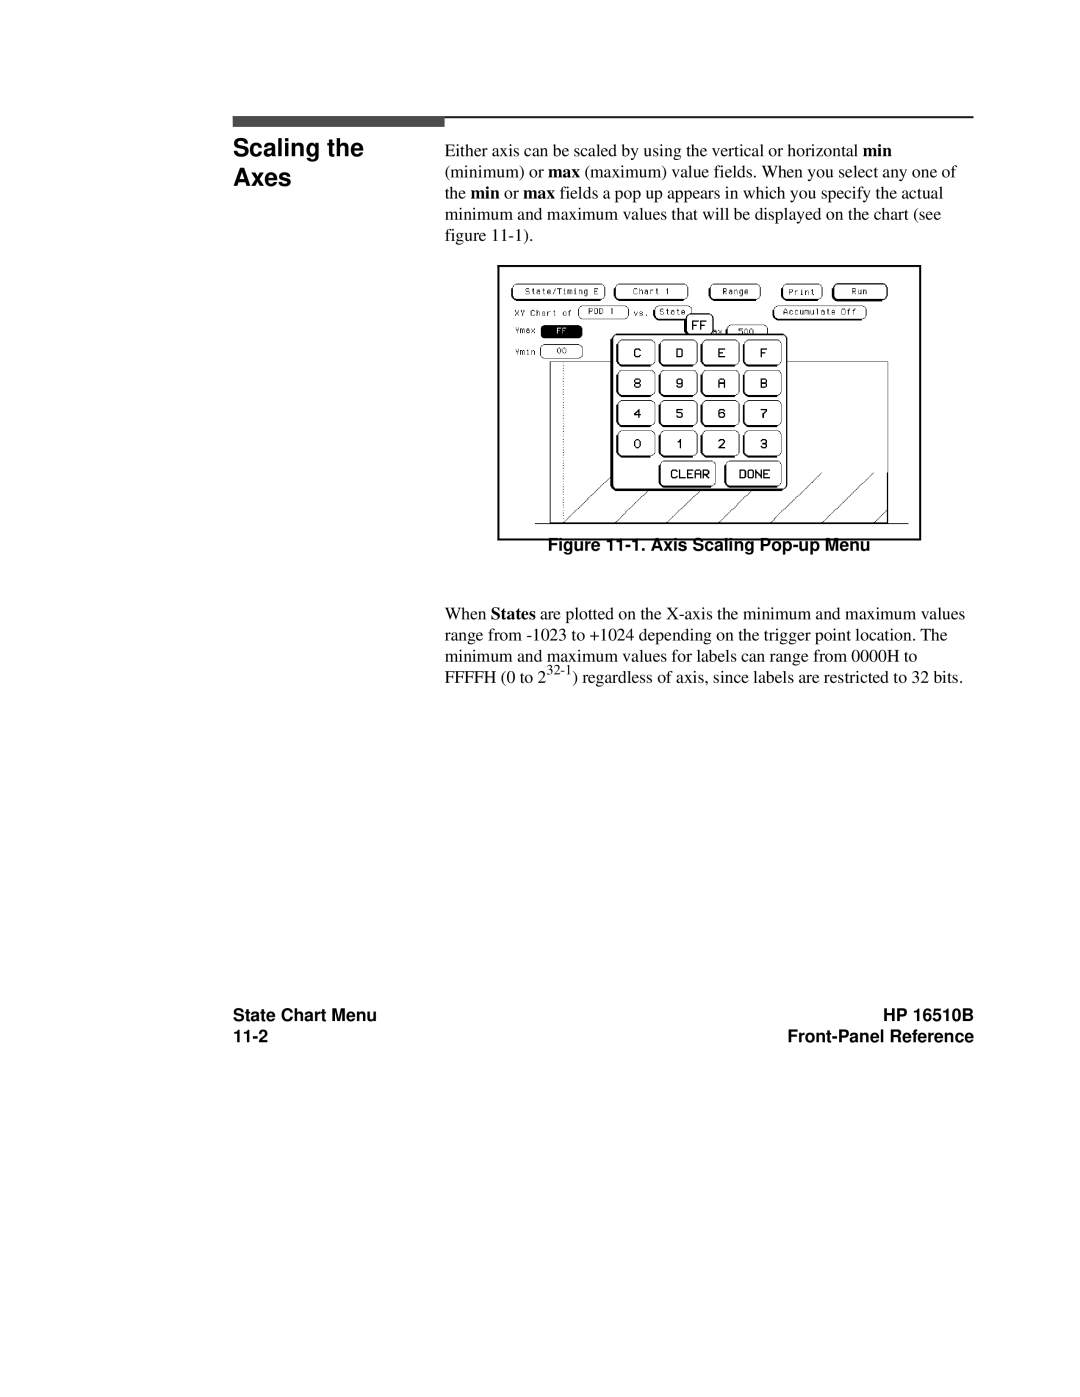
Either axis can be scaled by using the vertical or horizontal min (minimum) or max (maximum) value fields. When you select any one of the min or max fields a pop up appears in which you specify the actual minimum and maximum values that will be displayed on the chart (see figure
Figure 11-1. Axis Scaling Pop-up Menu
When States are plotted on the
State Chart Menu | HP 16510B |
|
|
