9... HYPERPLOT™ G RAPHIC DATA DISPLAY

CHANNEL NAME

The individual data channel names from the OMP-MODL Download file are listed. The names are assigned when developing a HyperNet and/or Post-Processing Net.

DISPLAY CHANNEL

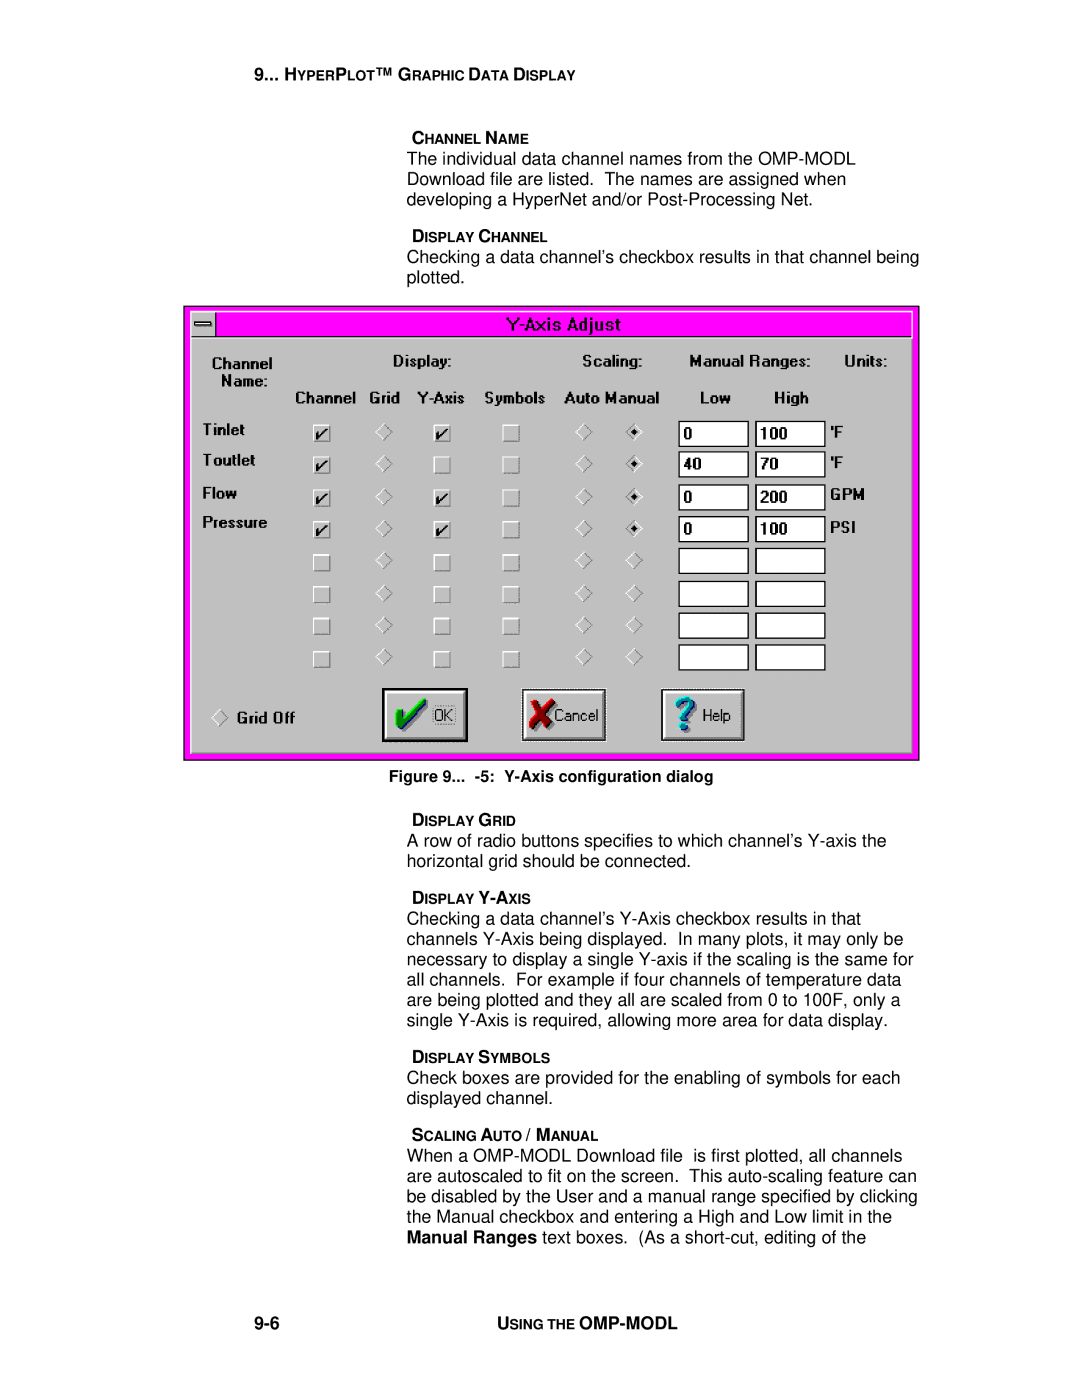
Checking a data channel’s checkbox results in that channel being plotted.

Figure 9... -5: Y-Axis configuration dialog

DISPLAY GRID

A row of radio buttons specifies to which channel’s Y-axis the horizontal grid should be connected.

DISPLAY Y-AXIS

Checking a data channel’s Y-Axis checkbox results in that channels Y-Axis being displayed. In many plots, it may only be necessary to display a single Y-axis if the scaling is the same for all channels. For example if four channels of temperature data are being plotted and they all are scaled from 0 to 100F, only a single Y-Axis is required, allowing more area for data display.

DISPLAY SYMBOLS

Check boxes are provided for the enabling of symbols for each displayed channel.

SCALING AUTO / MANUAL

When a OMP-MODL Download file is first plotted, all channels are autoscaled to fit on the screen. This auto-scaling feature can be disabled by the User and a manual range specified by clicking the Manual checkbox and entering a High and Low limit in the Manual Ranges text boxes. (As a short-cut, editing of the

9-6

USING THE OMP-MODL

Page 147
Image 147
Omega Vehicle Security OMP-MODL manual Y-Axis configuration dialog