Page
Page
Contents
Using The Snapshot Legacy Feature
Creating The Initial Snapshot Virtual Disk
Using The Virtual Disk Copy Feature
Using The Remote Replication Premium Feature
Using The Remote Replication Legacy Premium Feature
Maintaining a Storage Array
Script Commands 122
Commands Listed Alphabetically 133
181
227
268
303
351
386
415
New Commands
Updated Commands
Page
About The Command Line Interface
Usage Notes
How To Use The Command Line Interface
CLI Commands
Abc
Outputfile -p password -e -S
Outputfile-p password-e-S
Command Line Parameters
SMcli -d -w-i-s-v-S
SMcli -?
Host‑name-or-IP-address
Uppercase
Lowercase
Host‑name-or-IP-address is not used
Password=password command
Detailed Error Reporting
Formatting Considerations
Set storageArray userLabel=\Engineering\
Set storageArray userLabel= \\Finance\Array\
Exit Status
Usage Examples
SMcli -d
SMcli -n Example -f scriptfile.scr -e
SMcli -n Example -f scriptfile.scr -p MyArray o output.txt
About The Script Commands
Script Command Structure
Script Command Synopsis
Activate object statement‑data
Check object statement‑data
Recurring Syntax Elements
Suspend object statement‑data
Physical disk-channel-identifier physical disk
Page
Autoconfigure-vols-attr-value-pair
Create-virtual-disk-copy-attr-value-pair
Usage Guidelines
Adding Comments To a Script File
\Engineering\
Engineering
Clientsmcli 123.45.67.89 -c show storageArray profile
Configuring a Storage Array
Determining What Is On Your Storage Array
Clientsmcli 123.45.67.89 -c show storageArray summary
Show allVirtualDisks Show Virtual Disk
Create virtualDisk physicalDisks=
Saving a Configuration To a File
Using The Create Virtual Disk Command
0,1 0,2 0,3 0,4
Creating Virtual Disks In An Existing Disk Group
Using The Auto Configure Command
Enclosure Loss Protection
Page
Modifying Your Configuration
Setting The Storage Array Password
AutoConfigure storageArray Create virtualDisk
Set storageArray password=password
Setting The Storage Array Host Type
Setting Up Smtp And Snmp Alerts
Setting The RAID Controller Module Clocks
Setting Modification Priority
Assigning Global Hot Spares
Selecting The Event Levels For Alert Notifications
Configuring Alert Notifications
Before Using Snapshot CLI Commands
Snapshot Images And Groups
Snapshot Consistency Groups
Snapshot Groups And Snapshot Consistency Groups
Snapshot Groups
Snapshot Consistency Group Repositories
Understanding Snapshot Repositories
Consistency Groups And Remote Replication
Deleting a Snapshot Image
Creating Snapshot Images
Creating a Snapshot Image
Creating a Consistency Group Snapshot Virtual Disk
Create cgSnapImage consistencyGroup=consistencyGroupName
Creating a Consistency Group Snapshot Image
Deleting a Consistency Group Snapshot Image
Delete cgSnapImage consistencyGroup=alldata1
Scheduling Snapshot Images
Starting, Stopping And Resuming a Snapshot Rollback
Creating a Snapshot Group
Start snapImage snapGroup1 rollback
Stop snapImage snapGroup112345 rollback
Stop snapImage snapGroup1newest rollback
Deleting a Snapshot Group
Reviving a Snapshot Group
Creating a Consistency Group
Delete snapGroup snapGroupName deleteRepositoryMembers=TRUE
Setting Consistency Group Attributes
Deleting a Consistency Group
Adding a Member Virtual Disk To a Consistency Group
Removing a Member Virtual Disk From a Consistency Group
Syntax Applicable To One Or More Virtual Disks
SnapVirtualDisk command
Syntax Applicable To Only One Virtual Disk
Setting Snapshot Group Repository Virtual Disk Capacity
Revive diskGroup diskGroupName
Revive snapVirtualDisk snapVirtualDiskName
Using The Snapshot Legacy Feature
Create snapshotVirtualDisk
Re-create snapshot
Set snapshotVirtualDisk
Stop snapshot
Creating a Snapshot Virtual Disk
Enabling The Snapshot Virtual Disk Feature
Enable storageArray feature file=filename
Creating The Initial Snapshot Virtual Disk
Create snapshotVirtualDisk sourceVirtualDisk= MarsSpirit4
Page
User-Defined Parameters
Using the set snapshotVirtualDisk
EnableSchedule
RepositoryPercentOfSource
RepositoryFullPolicy
Changing Snapshot Virtual Disk Settings
Names Of Snapshot Virtual Disks And Repository Virtual Disks
Stopping And Deleting a Snapshot Virtual Disk
Re-creating The Snapshot Virtual Disk
Set virtualDisk MarsSpirit4-1 userLabel= MarsOdyssey3-2
Stop snapshot virtualDisks MarsSpirit4-2 MarsSpirit4-3
Recreate snapshot virtualDisks MarsSpirit4-2 MarsSpirit4-3
Preparing Host Servers To Re-create a Snapshot Virtual Disk
Re-creating a Snapshot Virtual Disk
About Virtual Disk Copy
Virtual Disk Copy Types
Enable storageArray feature
Create virtualDiskCopy
Recopy virtualDiskCopy
Remove virtualDiskCopy
Enabling The Virtual Disk Copy Feature
Creating a Virtual Disk Copy
Determining Virtual Disk Copy Candidates
Creating a Virtual Disk Copy
Preparing Host Servers To Create a Virtual Disk Copy
Copying The Virtual Disk
Viewing Virtual Disk Copy Properties
Changing Virtual Disk Copy Settings
Show virtualDiskCopy source JabaHut
Recopying a Virtual Disk
Preparing Host Servers To Recopy a Virtual Disk
Stopping a Virtual Disk Copy
Recopying The Virtual Disk
Recopy virtualDiskCopy target Obi1 copyPriority=highest
Stop virtualDiskCopy target targetName source sourceName
Interaction With Other Features
Removing Copy Pairs
Remove virtualDiskCopy target targetName source sourceName
Remove virtualDiskCopy target Obi1
Using The Remote Replication Premium Feature
How Remote Replication Works
Link Interruptions Or Secondary Virtual Disk Errors
Replication Pairs And Replication Repositories
Resynchronization
Remote Replication Requirements And Restrictions
Previous Users Of Remote Replication Legacy Premium Feature
Remote Replication Group
Setting Up Remote Replication
Enabling The Remote Replication Premium Feature
Activating The Remote Replication Premium Feature
Primary And Secondary Virtual Disks
SyncInterval
Changing Remote Replication Group Settings
Adding Primary Virtual Disk To Remote Replication Group
Role Force Nosync
Adding Secondary Virtual Disk To Remote Replication Group
Suspending a Remote Replication Group
Deleting a Remote Replication Group
Delete asyncRemoteReplicationGroups name1name2
Disabling The Remote Replication Premium Feature
Deactivating The Remote Replication Premium Feature
Interaction With Other Premium Features
Standard Remote Replication Commands
Remove asyncRemoteReplicationGroup
StorageArray iscsiIpAddress
Show asyncRemoteReplicationGroup
SynchronizationProgress
Using The Remote Replication Legacy Premium Feature
How Remote Replication Legacy Works
Replication Repository Virtual Disks
Replication Relationships
Data Replication
Write Modes
Link Interruptions Or Secondary Virtual Disk Errors
Resynchronization
Creating a Remote Replicated Pair
Performance Considerations
Enabling The Remote Replication Legacy Premium Feature
Activating The Remote Replication Legacy Premium Feature
103
Determining Candidates For a Remote Replicated Pair
Creating a Remote Replicated Pair
Changing Remote Replication Legacy Settings
Suspending And Resuming a Replication Relationship
Remove remoteReplication localVirtualDisk Jan04Account
Removing a Replication Relationship
Deleting a Primary Virtual Disk Or a Secondary Virtual Disk
Disabling The Remote Replication Legacy Premium Feature
Deactivating The Remote Replication Legacy Premium Feature
Disable storageArray feature=remoteReplication
Deactivate storageArray feature=remoteReplication
Virtual Disk Copy
Storage Partitioning
Virtual Disk Expansion
Routine Maintenance
Running a Media Scan
Set allVirtualDisks virtualDisk
Set storageArray mediaScanRate=disabled
Running a Consistency Check With a Media Scan
Resetting a RAID Controller Module
Resetting Battery Age
Enabling RAID Controller Module Data Transfer
Removing Persistent Reservations
Performance Tuning
Synchronizing RAID Controller Module Clocks
Locating Physical Disks
Monitoring Performance
Changing RAID Levels
Changing Segment Size
Save storageArray performanceStats file=filename
Set diskGroup diskGroupNumber raidLevel=0156
Enabling SSD Cache For a Virtual Disk
Using SSD Cache
Defragmenting a Disk Group
Creating SSD Cache
Adding Physical Disks To Existing SSD Cache
Removing Physical Disks From Existing SSD Cache
SSD Cache Performance Modeling
Diagnosing a RAID Controller Module
Troubleshooting and Diagnostics
Collecting Physical Disk Data
Recovery Operations
Setting RAID Controller Module Operational Mode
Set controller 0 1 availability=online offline serviceMode
Changing RAID Controller Module Ownership
Initializing a Physical Disk
VirtualDiskNameN virtualDisk wwid owner=0
Redistributing Virtual Disks
Reconstructing a Physical Disk
Initializing a Virtual Disk
Script Commands
Command Formatting Rules
0,1 0,2 0,3 1,0 1,1 1,2 1,3
NumberOfPhysicalDisks
Firmware Compatibility Levels
Commands Listed By Function
Disk Group Commands
Enclosure Commands
Host Topology Commands
ISCSI Commands
Physical Disk Commands
RAID Controller Module Commands
Remote Replication Commands
Session Command
Show String Command
Snapshot Commands
SSD Cache Commands
Storage Array Commands
Page
Virtual Disk Commands
Virtual Disk Copy Commands
Activate Remote Replication Feature
DrawerLossProtect=TRUE False dataAssurance=none enabled
Description
Syntax
Parameters
DataAssurance
EnclosureLossProtect
DrawerLossProtect
Activate Storage Array Firmware
Add Member To Consistency Group
Syntax For Use With An Existing Repository Virtual Disk
Activate storageArray firmware
ConsistencyGroup
AddCGMemberVirtualDisk
RepositoryVirtualDisk
Capacity
Add Physical Disks To SSD Cache
AddPhysicalDisks
Add Virtual Disk To Remote Replication Group
SsdCache
AsyncRemoteReplicationGroup
RemotePassword
VirtualDisk
Autoconfigure Storage Array
RaidLevel
DiskGroupWidth
DiskGroupCount
VirtualDisksPerGroupCount
HotSpareCount
SegmentSize
CacheReadPrefetch
Autoconfigure Storage Array Hot Spares
Blink SSD Cache
Syntax Applicable To Starting a Blink Operation
Syntax Applicable To Stopping a Blink Operation
UsageHint
Cancel Remote Replication Group Role Reversal
Change SSD Cache Application Type
Timeout
Check Remote Replication Status
Check Remote Replication Group Consistency
FileSystem
SnapGroup
Check Repository Consistency
File
Check Storage Array Connectivity
SnapVirtualDisk
VirtualDiskCopy
Target
RemoteStorageArrayNameWwid
Check Virtual Disk Consistency
RemoteStorageArrayName
Clear Physical Disk Port Statistics
Clear Remote Replication Fault
VirtualDisk virtualDiskName virtualDisks virtualDiskName1
All
AsyncRemoteReplicationGroups
VirtualDisks
Clear Storage Array Configuration
Clear storageArray configuration all diskGroups
Set Storage Array Core Dump
Clear Storage Array Event Log
DiskGroups
Set storageArray coreDumpAllowOverWrite
Clear Virtual Disk Reservations
Clear Storage Array Recovery Mode
Clear Storage Array Firmware Pending Area
Clear Virtual Disk Unreadable Sectors
AllVirtualDisks
VirtualDisk or virtualDisks
Clear allVirtualDisks virtualDisk
Configure Automatic Support Bundle Collection
Convert Snapshot Legacy Virtual Disk To Snapshot Group
Create Consistency Group
BaseVirtualDisk
PurgeSnapImages
RepositoryFullLimit
RollBackPriority
To False
Schedule
Create Consistency Group Snapshot Image
Syntax When Setting The Repository Full Limit
Create Consistency Group Snapshot Virtual Disk
Syntax With User Specified Base Virtual Disks
CgSnapImageID
Consistency group snapshot repository virtual disk
Create Consistency Group Snapshot Virtual Disk Mapping
CgSnapVirtualDisk
Host
HostGroup
DriveMediaType
Create Disk Group
PhysicalDisks
Capacity=500 bytes
Capacity=2 GB
Owner
FileSystem, dataBase, or multiMedia
Additional Information
Cache Read Prefetch
Create Disk Pool
Security Type
ReservePhysicalDiskCount
Syntax Parameters
PhysicalDiskCount
CriticalPriority
BackgroundPriority
PhysicalDiskMediaType
DegradedPriority
EnclosureLossProtect DrawerLossProtect
Security Type
DataAssurance AllocateReservedSpace
Use the show storageArray hostTypeTable command to
Create Host
Create Host Group
HostType
InterfaceType
Create Host Port
Identifier
Create iSCSI Initiator
Create RAID Virtual Disk Automatic Physical Disk Select
IscsiName
ChapSecret
DiskGroupUserLabel
DssPreAllocate
Create RAID Virtual Disk Free Extent Base Select
DiskGroup
Are fileSystem, dataBase, or multiMedia
Create RAID Virtual Disk Manual Physical Disk Select
SecurityType=none capable enabled dataAssurance=none enabled
Physical disk capacity available in the disk
Create RAID Virtual Disk On a Disk Pool
Capacity=500MB
Capacity=2GB
ThinProvisioned
Mapping
SnapImageID
ConvertToReadWrite command
Create Read-Only Snapshot Virtual Disk
Create Remote Replication
Primary
Secondary
RemoteStorageArrayWwn
SyncPriority
Create Remote Replication Group
RemoteStorageArrayNameWwn
Run the resume remoteReplicationGroup
Create Snapshot Group
SourceVirtualDisk
Action is purgeSnapImages
Medium
SnapGroup command
Create Snapshot Image
SnapGroup or snapGroups
Create Snapshot Legacy Virtual Disk
Syntax User-Defined Physical Disks
Syntax User-Defined Number Of Physical Disks
Syntax Existing Repository Disk Group
PhysicalMediaType
RepositoryPhysicalDiskCount parameter
Value is failSnapShot
Enclosure Loss Protection
Scheduling Snapshots Legacy
Option is startDate=062711
Example scheduleDay=wednesday
Create Snapshot Virtual Disk
TimesPerDay=4
You want to give to a snapshot virtual disk. Enclose
Create SSD Cache
UpdateExistingVirtualDisks
Create Storage Array Security Key
CommitSecurityKey
KeyIdentifier
PassPhrase
Create Virtual Disk Copy
TargetReadOnlyEnabled
Source
CopyPriority
CopyType
SnapConsistencyGroup
Deactivate Remote Replication Legacy
Delete Consistency Group
Delete Consistency Group Snapshot Image
DeleteRepositoryMembers
DeleteCount
RetainCount
Delete Consistency Group Snapshot Virtual Disk
Delete Disk Group
Delete Disk Pool
Delete Host
Delete hostGroup hostGroupName
Delete Host Group
Delete Host Port
Delete iSCSI Initiator
Delete Snapshot Group
Delete Snapshot Image
IgnoreSnapVirtualDisk=TRUE False snapImageID=OLDEST
IgnoreSnapVirtual Disk
Delete Snapshot Legacy Virtual Disk
Delete Snapshot Virtual Disk
Delete ssdCache ssdCacheName
Delete SSD Cache
Delete Virtual Disk
Delete allVirtualDisks virtualDisk virtualDiskName
Delete Virtual Disk On a Disk Pool
RemoveDiskGroup
Schedule RetainRepositoryMembers
However, when the retainRepositoryMembers
Diagnose RAID Controller Module
TestID
Controller
LoopbackPhysicalDiskChannel
IscsiHostPort
Diagnose RAID Controller Module iSCSI Host Cable
PatternFile
CableDiagnostics
Diagnose Remote Replication
Disable Storage Array Feature
Primary or primaries
Display Automatic Support Bundle Collection Configuration
SupportBundle auto show
Display Support Bundle Collection Schedule
Download Enclosure Management Module Firmware
SupportBundle schedule show
Enclosure
Filename
Download Physical Disk Firmware
PhysicalDisk
Download Storage Array Firmware/NVSRAM
Download Storage Array Physical Disk Firmware
NVSRAM-filename
Downgrade ActivateNow
Download Storage Array Nvsram
Enable Disk Group Security
File=C\Program Files\CLI\dnld
\afrm.dlp
HealthCheckMelOverride
Enable Disk Pool Security
Enable or Disable ODX
Enable diskPool diskPoolName security
Set storageArray odxEnabled=TRUE False
Syntax Applicable To a Snapshot Virtual Disk
Enable Or Disable SSD Cache For a Virtual Disk
Syntax Applicable To a Standard Virtual Disk
Enable or Disable Vaai
Enable RAID Controller Module Data Transfer
Set storageArray vaaiEnabled=TRUE False
VaaiEnabled
Establish Remote Replicated Pair
Enable Storage Array Feature
Enable storageArray featurePack feature file=filename
PrimaryVirtualDisk
Increase Virtual Disk Capacity On a Disk Pool
AsyncRemoteReplication
Load Storage Array DBM Database
Syntax Applicable To One Or More Virtual Disks
Controller 01 contentType=raidConfigration all
ContentType
Default is raidConfiguration
Validator
Modify Disk Pool
Recopy Virtual Disk Copy
AddDrives
AddCapacity
Name of the target virtual disk for which to
Recover RAID Virtual Disk
Ssid
Page
Preallocating Storage Capacity
Segment Size
Reserved Space on Physical Disks
Re-Create Remote Replication Repository Virtual Disk
Cache Read Prefetch
User-Defined Number of Drives
SAS
Re-Create Snapshot
Recreate snapshot virtualDisk virtualDiskName
Additional Information
Reduce Disk Pool Capacity
RemoveDrives
Create snmpCommunity communityName=snmpCommunityName
Register Snmp Community
Register Snmp Trap Destination
Reinitialize Thin Virtual Disk
ExistingRepositoryLabel
DiskPoolUserLabel
RetainRepositoryMember
Remove Member Virtual Disk From Consistency Group
Remove Physical Disks From SSD Cache
IncompleteAsyncRemoteReplication
ConsistencyGroupName
LocalVirtualDisk or localVirtualDisks
Remove Remote Replication
RemovePhysicalDisks
Offline
Remove Virtual Disk Copy
Remove Virtual Disk From Remote Replication Group
AccessVirtualDisk
Remove Virtual Disk LUN Mapping
Rename a Snapshot Virtual Disk
Rename SSD Cache
Repair Virtual Disk Consistency
Replace Physical Disk
PhysicalDisk wwID
CopyPhysicalDisk
Reset iSCSI IP Address
ReplacementPhysicalDisk
Reset Physical Disk
Reset physicalDiskenclosureID,drawerID,slotID wwID
Reset RAID Controller Module
Reset Remote Replication Group Statistics
SampleType is all
Reset Storage Array Battery Install Date
SampleType
Reset Storage Array iSCSI Baseline
Reset Storage Array SAS PHY Baseline
Reset storageArray iscsiStatsBaseline
Reset storageArray SASPHYBaseline
CgSnapImage
Reset Storage Array Virtual Disk Distribution
Resume Consistency Group Snapshot Virtual Disk
Resume Remote Replication
WriteConsistency
DeleteRecoveryPointIfNecessary
Resume Remote Replication Group
SnapImage
Resume Snapshot Image Rollback
Resume snapImage snapImageName rollback
Resume Snapshot Legacy Rollback
Resume Snapshot Virtual Disk
Resume rollback virtualDisk snapshotVirtualDiskName
Resume virtualDisk snapshotVirtualDiskName rollback
Resume snapVirtualDisk snapVol1 snapImage=snapGroup112345
Resume snapVirtualDisk snapVol1 snapImage=snapGroup1newest
Resume SSD Cache
Revive Disk Group
Resume ssdCache ssdCacheName
Revive diskGroup diskGroupNumber
Revive Disk Pool
Revive Physical Disk
Revive diskPool diskPoolName
Revive physicalDisk enclosureID,slotID
Revive Snapshot Group
Revive Snapshot Virtual Disk
Save Enclosure Log Data
Save Input Output RAID Controller Module IOC Dump
Save allEnclosures logFile=filename
LogFile
Save Physical Disk Log
Save RAID Controller Module Nvsram
Save allPhysicalDisks logFile=filename
Save controller 0 1 Nvsram file=filename
Save Remote Replication Group Statistics
\iscsistat.csv
RecordLimit
GlobalSettings
Save Storage Array Configuration
AllConfig
Save Storage Array Core Dump
Save Storage Array DBM Database
File=C\Program Files\CLI\logs
\events.txt
Save Storage Array DBM Validator Information File
DbmDatabase
CriticalEvents
Save Storage Array Events
AllEvents
Save Storage Array iSCSI Statistics
Save storageArray SASPHYCounts file=filename
Save Storage Array Performance Statistics
Save Storage Array SAS PHY Counts
Save storageArray stateCapture file=filename
Save Storage Array State Capture
Save Storage Array Support Data
Schedule Support Bundle Collection Configuration
For example, file=C\Program Files\CLI
Scheduling Snapshots
For example startDate=062711
Monday, tuesday, wednesday, thursday
ScheduleDay=wednesday
ScheduleInterval=180
EndDate=112611
Enter the create snapshotVirtualDisk
TimeZone=GMT-0600 or timeZone=USA
Set Consistency Group Attributes
Set Consistency Group Snapshot Virtual Disk
Set Disk Group
Set diskGroup diskGroupName
EnclosureIDn,slotIDn raidLevel=0 1 5 6 owner=0
Troubleshooting
Set diskGroup diskGroupName forcedState
Set Disk Group Forced State
Set Disk Pool
Set Disk Pool Complete
DiskPools
AllDiskPools
Set diskPool diskPoolName complete
Set Enclosure Attribute
Set Enclosure Identification
Set unBlockEventAlert eventType
Set Event Alert Filtering
Set blockEventAlert eventType
Set Foreign Physical Disk to Native
Set Host
HostGroupName
Set Host Channel
Set hostChannel hostChannelNumber preferredID=portID
HostChannel
PreferredID
Set Host Group
Set Host Port
Set hostGroup hostGroupName userLabel=newHostGroupName
Set hostPort portLabel host=hostName userLabel=newPortLabel
Set iSCSI Initiator
IscsiID
Set iSCSI Target Properties
Set Physical Disk Channel Status
Set Physical Disk Hot Spare
PhysicalDiskChannel
Status
Status to optimal or degraded
Set Physical Disk State
Set RAID Controller Module
ServiceMode service
Availability
EthernetPort
GlobalNVSRAMByte
Syntax Element Statement Data
RloginEnabled
ServiceAllowedIndicator
EnableIPV4=TRUE EnableIPV6=TRUE
Set Remote Replication
SnapVirtual Disk
Medium, low, or lowest
Enabled Automatic resynchronization is
Disabled Automatic resynchronization
Set Remote Replication Group
New name that you want to give to the remote
Role
Set Session
ErrorAction
Password
PerformanceMonitorIterations
Set Snapshot Group Attributes
PerformanceMonitorInterval
Set Snapshot Group Media Scan
MediaScanEnabled
ConsistencyCheckEnabled
Set Snapshot Group Repository Virtual Disk Capacity
Syntax For Increasing Capacity
Set Snapshot Group Schedule
Set Snapshot Legacy Virtual Disk
ScheduleInterval EndDate NoEndDate TimesPerDay TimeZone
Turns on or off the snapshot scheduling feature
316
Set Snapshot Virtual Disk Media Scan
Set Snapshot Virtual Disk Repository Virtual Disk Capacity
IsnsIPV4ConfigurationMethod IsnsIPV4Address
Set Storage Array
IsnsIPV6Address
CacheBlockSize
DefaultHostType
FailoverAlertDelay
CacheFlushStart
MediaScanRate
IsnsRegistration
Set Storage Array Enclosure Positions
EnclosurePostions
Set Storage Array Icmp Response
Set Storage Array iSNS Server IPv4 Address
Set storageArray icmpPingResponse=TRUE False
IcmpPingResponse
Set Storage Array iSNS Server IPv6 Address
Set Storage Array iSNS Server Listening Port
Set storageArray isnsIPv6Address=ipAddress
Set storageArray isnsListeningPort=listeningPortIPAddress
Set Storage Array Redundancy Mode
Set Storage Array Learn Cycle
RedundancyMode
Set Storage Array Security Key
Set Storage Array Time
Set Storage Array Unnamed Discovery Session
Set Thin Virtual Disk Attributes
Set storageArray unnamedDiscoverySession=TRUE False
UnnamedDiscoverySession
AddRepositoryCapacity
NewCapacity
RepositoryMaxCapacity
Syntax Applicable To Virtual Disk Mapping
Set Virtual Disk
Syntax Applicable To Only One Virtual Disk
CacheWithoutBatteryEnabled
MirrorCacheEnabled
VirtualDisk or virtualDisks name
CacheFlushModifier
ReadCacheEnabled
WriteCacheEnabled
LogicalUnitNumber
Set Virtual Disk Attributes For a Disk Pool
PreReadRedundancyCheck
Properties for all virtual disks in the storage
ReplicationCacheEnabled
AddCapacity SegmentSize UserLabel
Add Capacity, Add Physical Disks, And Segment Size
PreReadConsistencyCheck
Modification Priority
Cache Without Battery Enabled
Cache Flush Modifier
Set Virtual Disk Copy
Set Virtual Disk Mapping
For mapping Legacy snapshot and any virtual disk
Show Blocked Events
Show Consistency Group Snapshot Image
Show blockedEventAlertList
CgSnapImage or cgSnapImages
Show Current iSCSI Sessions
AllCGSnapImages
Show snapImage snapCGroup112345
Show snapImage snapCGroup1newest
TargetName
Show Disk Group
InitiatorName
Show Disk Group Export Dependencies
Show Disk Group Import Dependencies
Show diskGroup diskGroupNumber
Show diskGroup diskGroupName exportDependencies
CancelImport
Show Disk Pool
Show Host Ports
Show diskPool diskPoolName
Show Physical Disk
Show allHostPorts
Returns information about all physical disks
Show Physical Disk Channel Statistics
Show Physical Disk Download Progress
PhysicalDiskChannels
AllPhysicalDiskChannels
AllControllers
Show RAID Controller Module
Show allControllers controller 0 1 summary
Type. Use the show storageArray
Show RAID Controller Module Nvsram
Show Remote Replication Group
Show Remote Replication Group Synchronization Progress
AllAsyncRemoteReplicationGroups
Show Remote Replication Virtual Disk Candidates
Show Snmp Communities
Minimum Firmware Level
AllSnmpCommunities
CommunityName
SnmpCommunities
Show Snmp MIB II System Group Variables
Show Snapshot Group
Show snmpSystemVariables
Sys Name None Sys Contact None Sys Location None
Snapshot Groups
Summary
Show Snapshot Image
Syntax For Showing a Specific Snapshot Image
Show snapImage snapImageName
SnapImage or snapImages
Show Snapshot Virtual Disks
Show snapImage snapGroup112345
Show snapImage snapGroup1newest
AllSnapVirtualDisks
Show ssdCache ssdCacheName
Show SSD Cache
Snapshot Virtual DiskSNAPSHOT-IMAGE Based Summary
Show SSD Cache Statistics
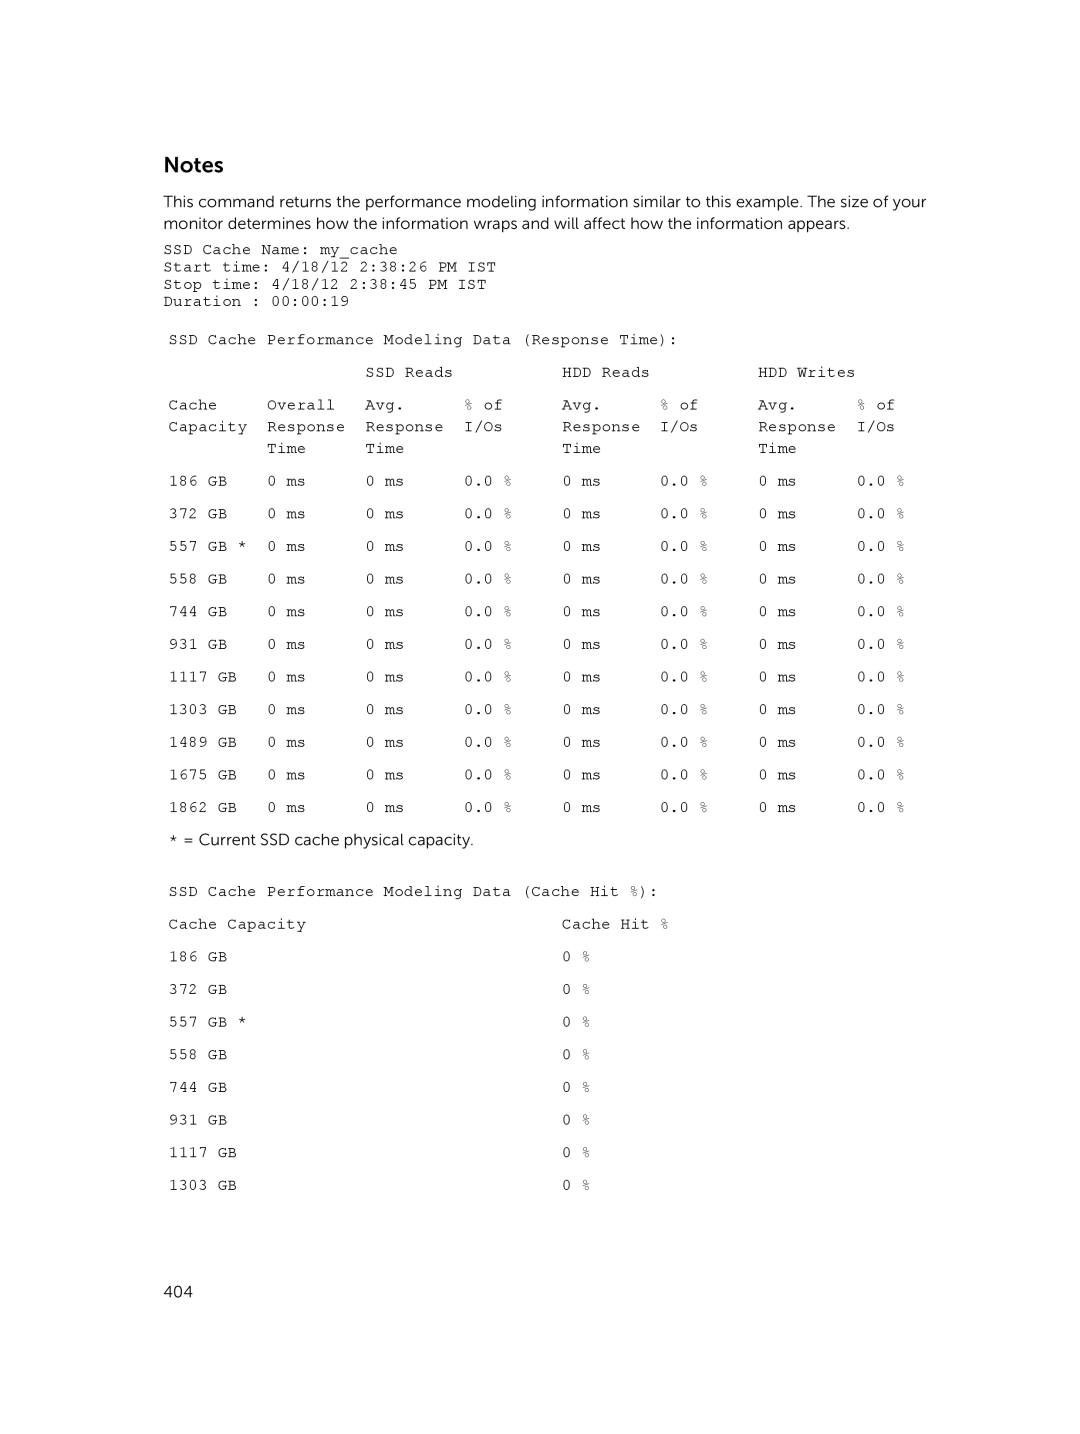
PerformanceModeling command
Reads
Cache
Misses Blocks
Show Storage Array
AutoSupportConfig
BatteryAge
HotSpareCoverage
Features
Show Storage Array Auto Configure
Show Storage Array Core Dump
Show storageArray coreDump
Show Storage Array DBM Database
Show Storage Array Host Topology
Show storageArray dbmDatabase
Show storageArray hostTopology
Topology Definitions Default Group
Show Storage Array LUN Mappings
Show storageArray iscsiNegotiationDefaults
Show Storage Array Negotiation Defaults
Show Storage Array ODX Setting
Show Storage Array Power Information
Show Storage Array Unconfigured iSCSI Initiators
Show storageArray odxsetting
Show storageArray powerInfo
Show Storage Array Unreadable Sectors
Show String
Show storageArray unreadableSectors
Show textString
Show Thin Virtual Disk
ConsumedCapacity
ExpansionHistory
Logged Time Expansion Type Start Capacity End Capacity
Show Virtual Disk
ManualAutomatic Nnnnnnnn bytes
Show Virtual Disk Action Progress
Show virtualDisk virtualDiskName actionProgress
Show Virtual Disk Copy
Show virtualDiskCopy source sourceName targetCandidates
Show Virtual Disk Copy Source Candidates
Show Virtual Disk Copy Target Candidates
Show allVirtualDisks virtualDisk virtualDiskName
Show Virtual Disk Performance Statistics
Show Virtual Disk Reservations
Start Consistency Group Snapshot Rollback
Start Configuration Database Diagnostic
Start storageArray configDbDiagnostic
Start cgSnapImage congroup1 rollback
Start cgSnapImage consistencyGroupName rollback
MemberVirtualDiskSet
Start Disk Group Blink
Start Disk Group Defragment
Start Disk Group Export
Start diskGroup diskGroupNumber blink
Start diskGroup diskGroupName import
Start Disk Group Import
Start diskGroup diskGroupName export
Start Disk Pool Locate
Start Enclosure Blink
Start diskPool diskPoolName locate
Start enclosure enclosureID blink
Start Input Output RAID Controller Module IOC Dump
Start iSCSI Dhcp Refresh
Start IOCLog 0,1 0,2 1,1 1,2 overwrite=TRUE False
Start controller 0 1 iscsiHostPort 1 2 3 4 dhcpRefresh
Start Physical Disk Blink
Start Physical Disk Channel Blink
Iscsi-host-port
Start physicalDisk enclosureID,slotID blink
Start physicalDiskChannel 1 2 blink
Start Physical Disk Initialize
Start Physical Disk Reconstruction
Start remoteReplication primary virtualDiskName synchronize
Start Remote Replication Synchronization
Start Remote Replication Legacy Synchronization
Start rollback virtualDisk snapshotVirtualDiskName
Start Secure Physical Disk Erase
Start Snapshot Rollback
SnapImage command
Start Snapshot Image Rollback
VirtualDisk or
Start snapImage snapImageName rollback
Run the stop ssdCache performanceModeling command
Start SSD Cache Performance Modeling
Start snapImage snapGroup112345 rollback
Start snapImage snapGroup1newestrollback
Start Storage Array Configuration Database Diagnostic
DiagnosticType
Start Storage Array Blink
Start storageArray blink
FileSystem
Start storageArray isnsServerRefresh
Start Storage Array iSCSI Refresh
Start Virtual Disk Initialization
Stop Configuration Database Diagnostic
Stop storageArray configDbDiagnostic
ConfigDbDiagnostic command
Stop Consistency Group Snapshot Rollback
Stop cgSnapVirtualDisk snapVirtualDiskName
Stop Consistency Group Snapshot Virtual Disk
Stop cgSnapImage congroup1 rollback
Stop Disk Group Blink
Stop Disk Pool Locate
Stop Enclosure Blink
Stop diskGroup blink
Stop Pending Snapshot Images On Consistency Group
Stop Physical Disk Blink
Stop Physical Disk Channel Blink
Stop enclosure blink
Stop physicalDisk replace enclosureID,drawerID,slotID wwID
Stop Physical Disk Replace
Stop physicalDiskChannel blink
Stop Snapshot Group Image
Stop Snapshot Group Pending Snapshot Images
VirtualDiskName
Stop Snapshot Legacy
\virtualDiskName\
Stop Snapshot Legacy Rollback
Stop rollback virtualDisk snapshotVirtualDiskName
Rollback command
Stop Snapshot Rollback
Stop Snapshot Image Rollback
Stop snapImage snapImageName rollback
Stop Snapshot Virtual Disk
Stop snapVirtualDisk snapVirtualDiskName
Stop SSD Cache Performance Modeling
\performance.csv
SSD Cache Performance Modeling Data Cache Hit %
Cache Capacity Cache Hit % 186 372 557 558 744 931 1117 1303
Stop Storage Array Configuration Database Diagnostic
Stop Storage Array Blink
1489 1675 1862
Stop storageArray blink
Stop Virtual Disk Copy
Stop Storage Array iSCSI Session
Stop Storage Array Physical Disk Firmware Download
Suspend Remote Replication
Suspend Remote Replication Group
Suspend SSD Cache
Test Remote Replication Group Connectivity
Suspend ssdCache ssdCacheName
Test Snmp Trap Destination
TrapReceiverIP
Update Snmp Community
Unregister Snmp Community
Unregister Snmp Trap Destination
Delete snmpCommunity communityName=snmpCommunityName
Update Snmp MIB II System Group Variables
NewCommunityName
SysName
SysContact
Update Snmp Trap Destination
SendAuthenticationFailureTraps
Validate Storage Array Security Key
SysLocation
Additional Information
Clientsmcli 123.45.67.89 -f scriptfile.scr
Configuration Script Example
Use the save storageArray configuration command
Page
417