Making Basic Measurements Using Spectrum Analyzer Mode
Measuring
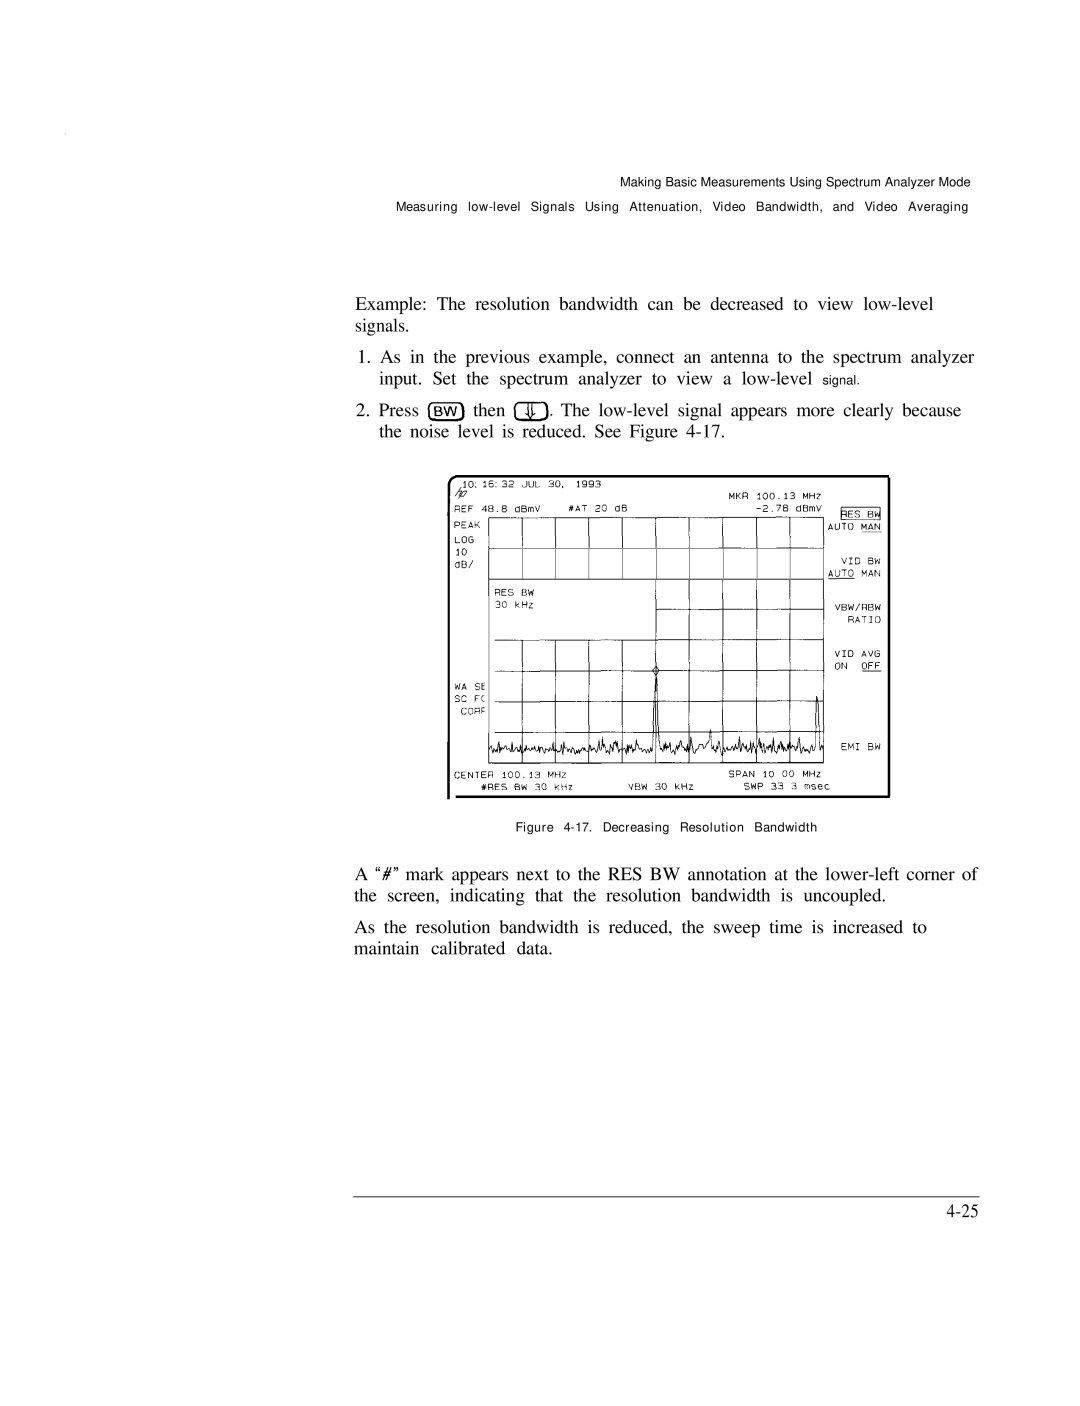
Example: The resolution bandwidth can be decreased to view
1.As in the previous example, connect an antenna to the spectrum analyzer input. Set the spectrum analyzer to view a
2.Press IBW) then m. The
0.16.32 JUL 30. IQ93
|
|
|
|
|
|
|
| MKR | 100.13 | MHZ | |||
|
|
| #AT 20 dB |
| dml” | ||||||||
PEAK |
|
|
|
|
| ||||||||
LOG |
|
|
|
|
| ||||||||
10 |
|
|
|
|
|
|
|
|
|
|
|
| “IO BW |
|
|
|
|
|
|
|
|
|
|
|
| ||
dB/ |
|
|
|
|
|
|
|
|
|
|
| ||
|
|
|
|
|
|
|
|
|
|
| m MAN | ||
|
|
|
|
|
|
|
|
|
|
|
|
| |
| 30 CHZ |
|
|
|
|
| |||||||
WA SE
SC FL
CORF
EM1 BW
| SPAN | 10 00 | MHZ |
“EM 30 KHZ | SWP | 33 3 | m5et |
Figure 4-17. Decreasing Resolution Bandwidth
A “#” mark appears next to the RES BW annotation at the
As the resolution bandwidth is reduced, the sweep time is increased to maintain calibrated data.