HP 8591C Cable TV Analyzer Spectrum Analyzer Reference
Regulatory Information
111
Limitation of Warranty
Exclusive Remedies
Assistance
Safety Notes
General Safety Considerations
HP 8591C Cable TV Analyzer Documentation Description
Options
How to Order Manuals
Contents
Getting Started
Page
Making Basic Measurements Using Spectrum Analyzer Mode
Spectrum Analyzer Mode Key Descriptions
Contents-6
Figures
Contents
Contents
Tables
Preparing For Use
What You’ll Find in This Chapter
Introducing the HP 8591C Cable TV Analyzer
Preparing For Use
Preparing Your Cable TV Analyzer for Use
Output is connected to EXT REF
Initial Inspection
E p a r i n g F o r U s e
Power Requirements
Setting the Line Voltage Selector Switch
Figure l-2. Setting the line Voltage Selector Switch
Checking the Fuse
Checking the Line Fuse
T E
Power Cable
81x-5182
Reference Connector
Turning on the Analyzer for the First Time
Turning on the Analyzer for the First Time
CAL TRK GEN
Performing the Tracking-Generator Self-Calibration Routine
CAL Store
Preparing For Use
Printing Using an RS-232 Interface
Printing or Plotting
Press @%?@, Print Conf fg
Interconnection and Printing Instructions
Turn off the cable TV analyzer and the printer
Preparing For Use
Preparing For Use
Preparing For Use
Turn off the cable TV analyzer
Plotting Using an RS-232 Interface
Interconnection and Plotting Instructions
Preparing For Use
Printing or Plotting Description
Printing Using an HP-IB Interface
Down
Preparing For Use
Preparing For Use
Preparing For Use
Plotting Using an HP-IB Interface
Paw
Disconnect or turn off the computer
Pen Description Number
Printing Using a Parallel Interface
Preparing For Use
T E
Preparing For Use
Plotting to an HP LaserJet Printer
Turn off the spectrum analyzer
Printing after Plotting or Plotting after Printing
Electrostatic Discharge
Reducing Damage Caused by ESD
Electrostatic Discharge
Getting Started
Getting Started
Front-Panel Features
Getting Acquainted with the Analyzer
Getting Started
U T I O N
Getting Started
Rear-Panel Features
Option 011 only
Option 107 only
Getting Started
Data Controls
T E
Adjusting the Fine Focus
Screen Annotation
Screen Annotation
Sweep Mode
MKR, l-1, MKRFCTN, or
Menu and Softkey Overview
Making a Measurement
Frequency Reference Level
Getting Started
Measurement Summary
Reading the Amplitude and Frequency
Improving Accuracy with Self-Calibration Routines
Warm-Up Time
Improving Accuracy with Self-Calibration Routines
Getting Started
Getting Started
CAL Store
When Is Self-Calibration Needed?
Memory Card Insertion and Battery Replacement
Inserting the Memory Card
Changing the Memory Card Battery
Procedure to Change the Memory Card Battery
Memory Card Battery Replacement
Analyzer Battery Information
10. Rear-Panel Battery Information label
Using Spectrum Analyzer Features
What You’ll Learn in This Chapter
Spectrum Analyzer
Using the Internal Preamplifier
Use the Marker Table to List All the Active Markers
Marker Table Display
Using Spectrum Analyzer Features
Use the Peak 7Jhble to List the Displayed Signals
Peak Table Display
Use the Peak Table to List the Displayed Signals
Saving and Recalling Data from Analyzer Memory
To Save a State
To Recall a State
Internal
To Save a Trace
To Recall a Trace
AMP CDR
Press Trace + Intrril This accesses a menu with Limit Lines
To Save a Limit-Line Table or Amplitude Correction Factors
To Recall Limit-Line lkbles or Amplitude Correction Factors
To Protect Data From Being Overwritten
Internal + State
Saving and Recalling Data from the Memory Card
Catalog Prefix
Preparing the Memory Card for Use
Using Spectrum Analyzer Features
To Enter a Prefix
To Save a State
To Recall a State
To Save a Trace
To Recall a Trace
To Save a Display Image
To Recall a Display Image
To Save Limit-Line l%bles or Amplitude Correction Factors
To Recall Limit-Line lhbles or Amplitude Correction Factors
AMP COR
Saving and Recalling Programs with a Memory Card
ALL DLP + Card
To Save a Program
To Recall a Program
Trace
Center
Using Limit-Line Functions
Procedure for Creating an Upper Limit Line
VI0
Using Spectrum Analyzer Features
Using Spectrum Analyzer Features
Completed limit-line Table
Limit-Line Functions
Usually used
Creating a limit line
Currently exists this will allow you to create one
Using limit-line Functions
Using limit-line Functions
T E
Limit-line Segments
Description of Items in Figure
T E
Demonstrates the different segment types
CT6
Using Limit4ine Functions
Procedure for Creating an Upper and Lower Limit Line
Flat
Upper and lower limit-line Testing
Learn About the Analog+ Display Mode
Uew I IHZ
Learn About the Windows Display
Center
Learn About the Windows Display
Using Spectrum Analyzer Features
Learn How to Enter Amplitude Correction Factors
A N
Procedure for Creating Amplitude-Correction Factors
Select Freq
Clear Write a View a
Clear Write
Amplitude-Correction Functions
13. Amplitude-Correction Points
Using Spectrum Analyzer Features
Using Spectrum Analyzer Features
External Keyboard
External Keyboard Functions
Key
@RsEmJ
External Keyboard
Using the External Keyboard
Timedate OM OFF OFF
T E
Making Basic Measurements Using Spectrum Analyzer Mode
Making Basic Measurements Using Spec- trum Analyzer Mode
Learn in This be1ow
Page
Making Basic Measurements Using Spectrum Analyzer Mode
Resolving Signals of Equal Amplitude
Page
Signal Resolution with a 10 kHr Resolution Bandwidth
Signal Resolution with a 30 kHz Resolution Bandwidth
Page
Using the Marker Counter
Cpeak S E a R C H
After Zooming In on the Signal
Maximum Hold and Minimum Hold Functions
Press PRESET, FREQUENCY, 100 MHz, ISPAN, 20 m
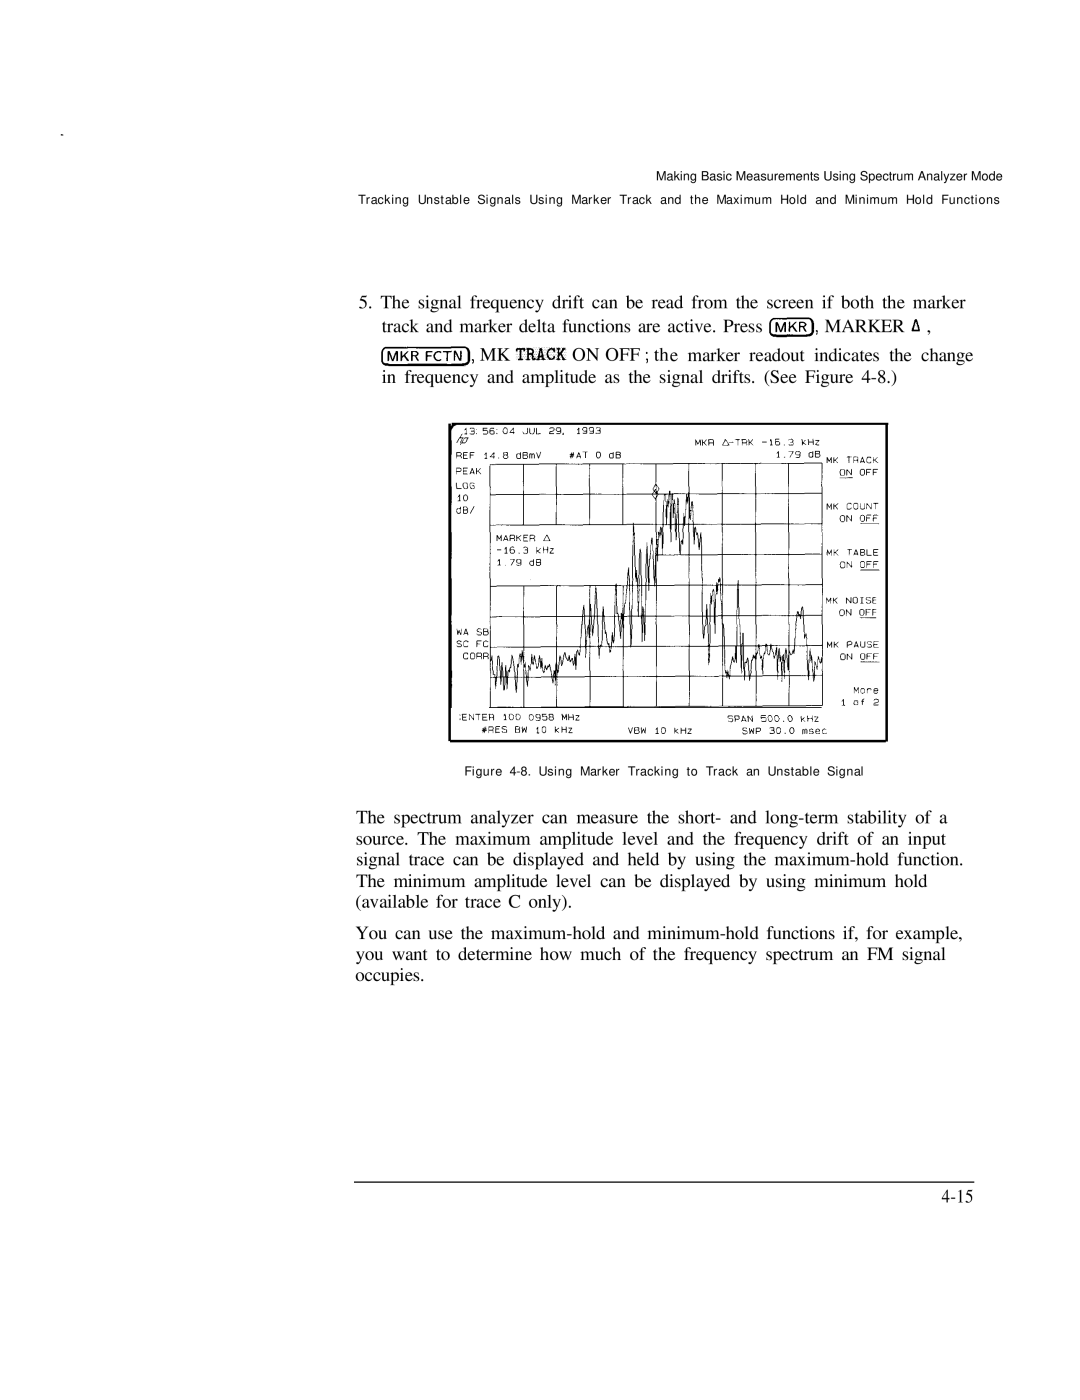
Using Marker Tracking to Track an Unstable Signal
Viewing an Unstable Signal Using Max Hold a
Ii JUL 29 MKA-TRK 100 963 MHZ
Comparing Signals Using Delta Markers
11. Placing a Marker on the CAL OUT Signal
Marker
13. Using the Marker to Peak/Peak Function
I i i i i i
Marker ALL OFF
Page
15. low-level Signal
MARKER-CF
16. Using 0 dB Attenuation
Auto ALL
17. Decreasing Resolution Bandwidth
Making Basic Measurements Using Spectrum Analyzer Mode
Video BW
Making Basic Measurements Using Spectrum Analyzer Mode
19. Using the Video Averaging Function
VID AVG OM OFF on
Distortion from the Analyzer
III II 11 1 l l
Making Basic Measurements Using Spectrum Analyzer Made
21. RF Attenuation of 10 dB
22. No Harmonic Distortion
23. Third-Order Intermodulation Equipment Setup
Third-Order Intermodulation Distortion
Making Basic Measurements Using Spectrum Analyzer Mode
24. Measuring the Distortion Product
Using the Analyzer As a Receiver in Zero Frequency Span
25. Viewing an AM Signal
26. Measuring Modulation In Zero Span
Making Measurements Using Spectrum Analyzer Mode
Making Measurements Using Spectrum Analyzer Mode
Page
Making Measurements Using Spectrum Analyzer Mode
T E
Making Measurements Using Spectrum Analyzer Mode
Making Measurements Using Spectrum Analyzer Mode
Making Measurements Using Spectrum Analyzer Mode
I7 c
Making Measurements Using Spectrum Analyzer Mode
Making Measurements Using Spectrum Analyzer Mode
Stimulus-Response Measurements
What Are Stimulus-Response Measurements?
Spectrum Analyzer Tracking Generator
Using a Spectrum Analyzer With a Tracking Generator
Transmission Measurement Test Setup
Stepping through the Measurement
Tracking-Generator Output Power Activated
Full Spqn Zero Span Last Span
Decrease the Resolution Bandwidth to Improve Sensitivity
Manual Tracking Adjustment Compensates for Tracking Error
Tracking Peak
T E
Normalized Trace
Tracking Generator Unleveled Condition
Demodulating and Listening to an AM or FM Signal
11. Demodulation of an FM Signal
Marker +CF
12. Continuous Demodulation of an FM Signal
Triggering on a Selected Line of a Video Picture Field
Center
14. Triggering on an Even Field of a Video Format
15. Time-Gate Utility Display
Making Measurements Using Spectrum Analyzer Mode
Gate Utility
Making Measurements Using Spectrum Analyzer Mode
Making Measurements Using Spectrum Analyzer Mode
T E
Introducing the Time-Gated Spectrum Analyzer Capability
When the time gate will be actively viewing
Gtpos LOG WC FC Corr
Making Measurements Using Spectrum Analyzer Mode
Page
Setting Comments
Example of a Time-Gated Pulsed RF Signal
Page
Pulse Generator #l
20. Setting the Center Frequency, Span, and Reference level
21. Setting the Sweep Time
Making Measurements Using Spectrum Analyzer Mode
Gate LENGTH, 13 @
23. Using Time-Gating to View Signal
24. Placing the Gate Output During the Second Signal
25. Viewing Both Signals with Time-Gating
26. Gate Not Occurring During the Pulse
‘E E
Length Bandwidth
Frequency PRF
CAL Store
Sweepsens
Making Measurements Using Spectrum Analyzer Mode
30. Gate On
31. Using the level Gate Control
Page
DB Bandwidth Measurement
32. N dB Bandwidth Measurement
DB Bandwidth Measurement
Percent Amplitude Modulation Measurement
33. Percent Amplitude Modulation Measurement
Percent Amplitude Modulation Measurement
Where the frequency of distortion product a is
Third Order Intermodulation Measurement
34. Third-Order Intermodulation Measurement
Making Measurements Using Spectrum Analyzer Mode
Page
Occupied Bandwidth and Transmitter Frequency Error
35. Occupied Bandwidth
Adjacent Channel Power Ratio ACP
Adjacent Channel Power
37. Adjacent Channel Power Extended
T E
Channel Power Measurement
39. Channel Power
40. Channel Power Graph
Spectrum Analyzer Mode Key Descriptions
Spectrum Analyzer Mode Key Descriptions
Service Functions
Service Calibration Functions
CAL Timerase Edit Flatness Execute Title Exit
Idnum Init FLT SET Attn Error Stor PWR on Units
Service Diagnostic Functions
Following diagnostic softkeys Option 011 only
Service Functions
On OFF Lock on OFF
Spectrum Analyzer Mode Functions
AI4
KHz EM1 BW 120 kHz
Fbr Option 130 only
+ a on OFF
Abcdef
ADJ Chan
ADJ Chan PWR extd
Spectrum Analyzer Mode Key Descriptions
ALC Test
ALL DLP --t Card Amp Cor
AMP COR AMP C5R On OFF
Amptd I t s
ANALOG+ on OFF
Front-Panel Key Access jD’spLAy-1
MKR CNT on OFF MK Pause on OFF MAX Bold a MAX Hold B
Apnd CAT Item
Option 021 only
Atten
T O C O U P L E
Aux Corm Corl~rol
Auxb
Default Config
Baud Rate Binary Span Blank a Blank B Blank C Card
CAL Fetch
CAL
Card Conf ig
Display
Card + DLP + State
Spectrum Analyzer Mode Key Descriptions
Catalog AMP COR
Front-Panel Key Access @iTTiE or Save
Memory Card Catalog Information Title Description
Catalog VARIABLS, Catalog PREFIX, Catalog DLP
Analyzer Memory Catalog Information
Atalog LMT Line
Ondelay
Oneos
Onswp
Trmath
Front-Panel Key Access I-1 or Isave
Command
Catalog on Event Display
Front-Panel Key Access mj or Save
Catalog
Trdef
Change P r e f i
Spectrum Analyzer Made Key Descriptions
Channel
Channel Spacing
Clear Write a
Clear Write B
Clear Write C
Cntl a 0 Cntl I3 0 Cntl C 0 Cntl D 0
Cont
Coarse
Conf
Series and L-Series Spectrum Analyzers and HP 8591C
Spectrum Analyzer Mode Key Descriptions
Draws trace B
Copy DEV Prnt PLT Correct on OFF
CRT Vert Position
Dacs
DBmV
Default Sync
Define Coupling F i n e Gate Time
Option 107 on
Front-Panel Key Access m or lsAVEJ
Delete
Dehod AM FM
Detector PK SP NG Display CAL Data
Display Cntl
Front-Panel Key Access fj%i%%$
Display --f Card
Done Droop DSP Line on OFF Dwell Time
I t
Edit
Done
Flatness
Edit Last
I t Lower
Mid/Delt
I t UPPer
I t o r
Enter PRI
Enter REF Edge Width
Erase DLP MEM
Front-Panel Key Access GGiZ
Trcmem
Erase
Traceall
EP LQ570
SML LRG EP FIX80
SHOWremoves the screen annotation left after pressing
Show Optioms
Spectrum Analyzer Mode Key Descriptions
FFT
FFT OFF FFT Stop Freq
Fine Tibg DAC
FM Offset
A t n e s s Data
FM Coil Drive FI4 Gain
FM Span Format Card Free RUN Freq Diag Freq Disc Norm OFF
Freq Offset
Gale N t r o l
Gate CTL Edge LVL
Option 107 on Ly
Gate on OFF Gate Utility
GHI JKL
Grat On OFF
Hold
HP B&W Printer Idnum Init FLT
Input Z 5oi-l ml
Internal Card Internal + State
Limit Lines Lippits FIX REL
Last Span
Limit N e s
Spectrum Analyzer Mode Key Descriptions
Limits FRQ Time Line Lpit Disp Y N Auto
Load File
Catalog TRACES, Catalog PREFIX, Catalog DLP
Rain Span
Marker # on OFF
Option 011 on
Front-Panel Key Access MKR or Cpeak Search
Marker a
Marker A-SPAN MARKER+ Auto FFT
Marker 4F Step
Front-Panel Key Access j-1, ?XiGj, or
MARKER+ FFT Stop MARKER-+ MID Scrn
Marker +REF LVL
MARKER-, Miwimum
Marker -START
MAX
Marker
Marker -4F, Marker +REF LVL , Marker -&F Step
MAX Hold B MAX MXR \TL Meas OFF
HP 8590 E-Series and L-Series Spectrum Analyzers
MEM Locked MIN Hold C
MK Noise on DFF MK Pause on OFF
MK Trace Auto ABC
Mnopqr
DB PTS on OFF
Next Peak Next PK Left Next PK Right
Menu
Ntsc
Spectrum Analyzer Mode Key Descriptions
Spectrum Analyzer Mode Key Descriptions
Paintjet Printer
PAL
PAL-M
Peak
Front-Panel Key Access Cpeak S E a R C H 108
Peak Zoom PK Node DL NH4
PK Table on OFF
O t Conf ig
PLTS/PG 1 2
PLT-LJT On OFF Point
Power Menu
Front-Panel Key Access Config 111
112
HP 8591C 900 MHz GHz S /auto-coupled
114
12. Preset Conditions for All Models
115
116
I n t Config
L s e ParaIti
Purge Limits
PWR SWP on OFF
Recall AMP COR
REF LVL
Spectrum Analyzer Mode Key Descriptions
SAV Lam
Front-Panel Key Access Isave 123
RPG Title
Spectrum Analyzer Mode Key Descriptions
Save Edit
Save Limit Scale LOG LIN
SECAM-L
Select 1 2 3
Select
Select Segment
Select Type
R v i c e Cal R v i c e Diag
Set Colr P r i n t e r
SET
Options Signal
133
Single FFT Single ME AS
Speaker On OFF
Slope
Ispan or Span
Spectrum
SRC PWR STP Size Start State + Card
Stop
State + Intrnl
Sweep Delay
Sweep Cont SGL
WE’ Cplg SR SA
NRM PAL
Table dDL NRM
Time Date
TO1 On OFF
Trace Trace a Trace B Trace C
Spectrum Analyzer Mode Key Descriptions
A c e N t r n l Track Gen
Tracking
Trig
TV Trig
TV Trig Even FLD
TV Trig Vert INT
Spectrum Analyzer Mode Key Descriptions
152
View
Video
View B
Zero Marker Span
Watts
YZ,# s p c C l e a r
Center
PK Left
Spectrum Analyzer Mode Key Descriptions
Key Menus
Key Menus
Key Menus
Key Menus
Key Menus
Spectrum Analyzer Mode Functions ElCOPY
Key Menus
Spectrum Analyzer Mode Functions MKR MARKERNcm.ML
Spectrum Analyzer Mode Functions MKR
Spectrum Analyzer Cable TV ANALYZER- TV Receiver ~
Key Menus
Key Menus
Key Menus
Page
ElSGL ClSPAN
Trace
Key Menus
If You Have a Problem
If You Have a Problem
Calling HP Sales and Service Offices
Before You Call Hewlett-Packard
Check the basics
If you suspect the analyzer configuration is wrong
Default Config Default Config
If the display position is offset
CRT W&T Position
If the analyzer measurements appear inaccurate
Cqnf Test
If the display is scrambled
If the calibration routines cannot be performed
If the calibration data is corrupt
Default CAL Data
How to Call Hewlett-Packard
US Field Operations
Returning the Cable TV Analyzer for Service
Package the cable TV analyzer for shipment
Returning the Cable TV Analyzer for Service
Error Messages
ADC-2V Fail
ADC-GND Fail
ADC-TIME Fail
CAL Data not Stored CAL AMP Needed
CAL Signal not Found
CAL Passcode Needed
CAL RES BW Ampl Fail
CAL Span Sens Fail
Conf Test Fail
CAL Using Default Data
CAL Zero Fail
Empty DLP MEM
Freq Uncal
Invalid Card Data Error
Internal Locked
Invalid Actdef
Invalid Ampcor Freq
Invalid Card Directory
Invalid Card no Card
Invalid Card Type
Invalid Checksum Ustate
Invalid File no Room
Invalid HP-IB ADRS/OPERATION
Invalid HP-IB Operation REN True
Invalid Item
Invalid Register Number
Invalid Repeat MEM Ovfl
Invalid Repeat Nest Level
Invalid RS-232 Adrsoperation
Invalid Tracename
Invalid Value Parameter
Invalid Vardef
Invalid Window Type
Meas Uncal
Oven Cold
Parameter Error
Passcode Needed
POS-PK Fail
REF Unlock
Rfpreselerror
RF Presel Timeout
Setup Error
Signal not Found
TG Signal not Found
Step GAIN/ATTN Fail
Table Full
TG Unlvl
Undf KEY
VID-BW Fail
Options and Accessories
Options and Accessories
HP-IB Interface Option 02
Tracking Generator Option 0
Carrying Case, Color Tan Option
Noise Figure Card Option
Front Panel Protective Cover Option
TV Receiver/Video Tester Option
Narrow Resolution Bandwidths Option
Rack Mount Kit without Handles Option
User’s Guides and Calibration Guide Option
Service Documentation Option 9
Rack Mount Kit With Handles Option
AC Power Source
RF Bridges
External Keyboard
HP-IB Cable
Memory Cards
Plotter
Printer
Rack Slide Kit
RS-232 Cable
Transit Case
Glossary
Glossary
Ascii
See memory card
Cispr
Correction factor
Detector mode
DLP
FFT
See FFT
See time-gate
HP-IB
Glossary-13
Limit line
Meas Uncal
Measurement bandwidth
Menu
Noise marker
Standard units of measure, which include the following
See CRT persistence
Refer to noise sidebands
Trace A, B, or C of an analyzer. Refer also to trace
Random-access memory
Refer to frequency resolution
See bandwidth selectivity
Refer to bandwidth selectivity
See noise sidebands
One of the sine waves comprising a spectrum
Spectrum analyzer
Solving for sweep time
TO1
Vector display
Video filter
Index
Index
Index-2
Index-3
Index-4
Index-5
Index-6
Index-7
Clear Write a Clear Write B
Index-8
Gate CTL Edge LVL, 6-76 Gate on OFF
Index-9
DAC
Index
Display
Index
FFT
Stop, 6- 138 FREQUENCY, 2-4, 2-17
Gate on OFF Gate Output
FFT, 6-133 IDNUM, 6-3
Gate Length
Local -44 kLOCALZ,6-87
Marker ALL OFF
Index
Index-20
Index-21
Index-22
Index-23
Index-24
Index-25
Index-26
MEM Locked
Index-27
Index-28
Index-29
Sweep Cont SGL
Index-30
Index-31
Index-32
Index-33
Index-34
Fine Tune DAC, 6-5 YZ-# Spc Clear