3C15500
3Com Network Director User Guide
United States Government Legend
3Com Corporation Campus Drive Marlborough MA USA
Page
Page
Contents
Product Activation
Main Window
Monitoring Logging VLANs
Discovering the Network
110
Other Clouds 103
124 Summary Pane 126
128
158 Device Icons Pull-Right Menu for Devices 161
143
166 167 Clouds
217
193
241
225 Files Associated with Saved Maps 226 Network Login
242 Properties Dialog Box for a Subnet 244
245
282
Overview
290 Exporting a Graph Zooming into a Graph 291
Showing Thresholds 289
300
321
337
325 Alerts
343
369 Examples Viewing the Unresolved Events for a Subnet 370
364 Attaching Alerts to Items 366 Configuring Alerts
371
378
No Graph Available for an Event 383
383
395 Mapping file format
400
404 History Host 405
What is Rmon 404
405 Matrix 406
425
458
455
471
Configuring Single Devices
497
Vlan Management
568
550
Useful Information and References 569
Configuring the Device as a Radius Client
Configuring Access Rights 596 Configuring Trusted IP Hosts
Reference C
584 Editing Device and Port Selections
644 Prioritizing a Video Conferencing Application 645
635 Applications Step 636 Application Field Values 637
648
Servers That Cannot be Selected for Blocking 660
652 DiffServ Codepoint Field
661
662
Agent Image Filenames
676
Overview Key Concepts 681 Multi-Site Networks
NBX Support
761 Monitoring a Phone Monitoring a Line Card 762
770 NBX NetSet Key Considerations Troubleshooting
768 Useful Information and References 769 NBX system
789 Specify Telnet Login Information Step 790
784 Device Backup Events
792 Restore Summary Report Setup Components
787 Specify Device Being Replaced Step 788
793 Specify Source Backup Step 794
Configuration Source Type Step 793
Why Errors can Occur during Restore and Setup 809
795
About Device View 852 Management Support Matrix
3C OM D Evice V IEW
855
Register Your Product to Gain Service Benefits
Page
Page
About this Guide
Text Conventions
List conventions that are used throughout this guide
Icon Description
Convention Description
Pddtechpubscomments@3com.com
Which can be accessed through the application
About this Guide
Getting Started
All its major features
Use Windows Explorer to browse the CD and access the files
Displayed which enables you to
Start using 3Com Network Director with your 3Com devices
Create a new network map
Specify Subnets Step
Discovery Type Step
Monitor Core Devices and Links Step
Community Strings Step
Summary Step
Scheduled Discovery Step
Coexistence with 3Com Network Director
Using saved Network Supervisor maps
Device Warranty feature
Using saved 3Com Network Supervisor files
Network Discovery
Main Window
Network Monitoring
Main Features
For more information, see Upgrading Device Software on
For more information, see Bulk Configuration on
Main Features
Getting Started
Customer support for 3Com Network Director for the duration
Describes how to activate 3Com Network Director
Relating to both this and other associated products
This chapter covers the following topics
Process
This number when it is first installed
Product Number the part number of your software, which
Starts with ‘3C’
About Dialog Before Registration
Activation Wizard License Key
Wizard consists of two steps as follows
If you prefer, you can register your product manually at
Outside US, Canada and Latin America
US, Canada and Latin America
Activating 3Com
Network Director
Where can I find the license key for 3Com Network Director?
What if I lose my Activation Key after registration?
What product number is right for me?
Why can’t I log in to the 3Com support web site?
Product Activation
Key Considerations
License Key Warning
Troubleshooting
Product Activation
Director
Main Window
To the main window
Describes the operations you can perform from this window
Following section describes the features of the main window
For a selected link the text displayed is
Menu Item Hot Key Operation
File Menu
Menu Item Hot Key Operation
Edit Menu
See Deleting Items from the Map
View Menu
Grouped Network View on
Background Images on
Management on page 491 for more
Device Menu
Monitoring Menu
Device Setup
Rmon Menu
Alerts/Events Menu
Statistics group on page 417 for
Tools Menu
User Guide on
Tree
Saved
Scheduled Tasks Menu Option
File New File Open Edit Add Device Edit Delete
General
General Tab
Device Management
Components
Internet
See Live Update on page 811 for more information
Monitoring
Discovery
Monitoring Tab
Logging
See Performance Reporting on page 385 for more information
VLANs
Retry/Timeout
Retry/Timeout Tab
Security Tab
Guide
Index Menu Option
Dialog box is displayed
Help About 3Com
Number
You have a query about an aspect of 3Com Network Director
Activation Key
Activation key
About Dialog Box License Number
Process and the steps you can take to overcome them
About your network
Discovery process itself
This chapter. This section explains the key concepts behind
Stages. The main concepts associated with these operations
Associated stages are outlined in this section as follows
IP Ping
Purpose of each stage is described below
Device Capability Detection
Snmp Type Detection
IP to MAC Resolution
End Station Type Recognition
Web Type Recognition
DNS Name Resolution
NBX Phone Detection
Device Sizing
Sizing stage
Remote Poll Stage broadcast ARP
Spanning Tree stage
Initial Endstation stage
Device Resolution Stage
Remote Poll Stage directed pings
Tree Building Stage
Outstanding end station stage
Clouds Unknown Topology
Clouds Unknown Topology
Edge Switch Unknown Topology
Other Clouds
Discovering the Network
Key Concepts
Discoveries
Scheduled
File New
Welcome dialog box
Tools Network Discovery with a discovered subnet selected
Tools Network Discovery with nothing selected
Undiscovered Subnet
Tools Network Discovery with an undiscovered subnet selected
This is the first pane of the wizard
Discovery Type Pane
Adding subnets to the list
Specify Subnets Pane
Add Subnet Dialog Box
Add Range Dialog Box
Removing subnets from the list
Editing subnets in the list
Choosing from a list of known subnets
Find Subnets List
Query Failure Dialog Box
Importing subnets from a file
Monitor Core Devices and Links Pane
Community Strings Pane
Community Strings Pane
NBX Call Processors Pane
NBX Voice Network Pane
NBX Call Processors Pane
Discovery Options Pane
Components
Scheduled Discovery Pane
Scheduled Discovery Pane
Options Dialog Box Discovery Tab
Summary Pane
Network Discovery Wizard Summary Pane
Network Discovery Progress Dialog Box
Network Discovery Progress Dialog Box Minimized
Network Discovery Summary Dialog Box
Network Discovery Summary dialog box
Components
Topology
Initial Map Creation
Midnight?
Subsequent Map Updates
Directly From the Options dialog box
Am is midnight and 1200 pm is midday
From the Discovery Wizard
Scheduled Discovery Pane
Discovering the Network
Network how do
Useful Information References
There are clouds in my map
Some devices are the wrong type
Discovering the Network
Key Considerations
Discovered
Discovery Section
Following devices
Discovery Report Errors and Warnings
Following devices returned invalid port information
Topology Section
Discovery Report Errors and Warnings
Discovering the Network
Discovery Report Errors and Warnings
Discovering the Network
Following topics are covered in this chapter
Within 3Com Network Director
Map
3Com Network Director
IconDescription
Icons Used in the Map
IconDescription
Example Tree
Map Structure
Components
Device Groups Example
Device Icons
Devices
Device Icon Description
Network Infrastructure Device Icons
Device Icon Description 3Com Wireless LAN Access Point
NBX Networked Telephony Solution Icons
Telephony Solution Icon Description
End Station Icons
Pull-Right Menu for Devices
Devices Pull-Right Menu Options
End Station Icon Description Standard end station
3Com Device View on page 475 for more information
Menu Item Operation
Physical Links
Physical Link Annotations
Unvalidated Links
Annotation Type Graphical Description Representation
Pull-Right Menu for Physical Links
Spanning Tree Protocol Support
Physical Links Menu Options
Attach Alerts Dialog Box on page 364 for more information
Layer-3 Connections
Layer-3 Connections Menu Options
Pull-Right Menu for Layer-3 Connections
Label Description
Clouds and Submaps
Subnets
Pull-Right Menu for Clouds
Subnet Icon’s Name
Undiscovered Subnets
View Filtered Events
Subnets Menu Options
Grouping Devices into a Device Group
Device Groups
Ungrouping Device Groups
Device Groups Menu Options
Pull-Right Menu for Device Groups
Tooltip
Tooltips
Tooltip Displays
Map Item Labels and Address Translation
Map Item Information Displayed
Custom Name
Label Type Label Source
Becomes
Vendor Translation of MAC Addresses
Working with the MAP
Translate MACs Option
Selecting Multiple Map Items in the Currently Viewed Map
Selecting Items in the Map and Tree
Release the mouse button
Selecting Multiple Map Items
Selecting Multiple Items in the Tree
Panning
Selection and the Pull-Right Menu
Zoom
Fit to
Zoom out
Toolbar Zoom Buttons
Button Action Zoom
Navigating Between Submaps and the Top-Level Map
Using the Zoom Rectangle
Title Bar Displays
Pull-Right Menu for Map Background
Currently Viewing Text Displayed in Title
Pull-Right Menu Options from the Map Background
Shortcut Symbols
Shortcut Icon
Navigating Around the Map Using the Tree
Trace Path
Viewing the VLANs on Your Network
Trace Path Example
Changing the Displayed Path
Button Action Explanation
Using the Filtered Trace Path View
Trace Path Wizard
Using The Trace Path Wizard
This button launches the Find dialog box
Finding Items on Your Network
Using Wildcards to Find Partial Matches
Searching Within the Search Results
For example
Wildcard Characters
Wildcard Matches
Finding Devices
Using the Find Dialog Box to Select Items for Operations
Option Description
Address address
Search by Option Description
Finding Links
Finding NBX Telephony Components
Speed Duplex mode Spanning tree mode
Search by Option Description
Comment field
Automatic Relayout of Maps
Manual Layout of Map Items
Adding Items to the Map
Manually Modifying the Map Contents
Add Map Item Dialog Box
Deleting Items from the Map
Linking Items in the Map
Keeping the Map Up-to-date
Login on
Working with the MAP
Default Map Location
Exporting Maps to Microsoft Visio
Export to Visio Dialog Box
Working with the MAP
Components
Common tasks with the map and tree
Following section provides some examples of how to perform
Network
Launch the Find dialog box by selecting Edit Find
Select 3Com Switch 4400 from the Device type list
Search Results Table
Select Tools Reports to launch the capacity report
Viewing Devices without Grouping by Subnets
Double-Clicking on a Router in the Tree
Focusing in on a Set of Devices in the Map
Zooming
Adjusting the Magnification
Locating the Two Devices
From Different Submaps
Selecting Edit Add Link
Map
Opening the Submap
Selecting Edit Add Map
Selecting Properties
3Com Switch
NBX Network Telephony Solution
3Com Wireless Access Points
Tree
Files Associated with Saved Maps
Filename Contents
Saved Map Files
FilenameContents
Network Login
Discovered
Dialog box
It allows you to
Items on the network map
See for more information
Items Supported by the Properties Dialog Box
Items on network
Selected item
Structure Tabbed Pane
Description of the Tabs in the Properties Dialog Box
Tab Title Contents
Device Tree
Tab Title Contents
Device Tree
Components
Tabs for a Node
Tabs for an interface
Tabs for a Port
Tabs for an Aggregated Link
Tabs Available for a Unit/Slot
Aggregated links on the device, as shown in Figure
Properties Dialog Box for a Supported Device Single Unit
Properties Dialog Box for an Unsupported Device
Properties Dialog Box for an End-Station
Properties Dialog for a Phone
Phone tab
Tabs available for a subnet are shown in Table
For a Subnet
Tabs available for a Subnet
Properties Dialog Box for a Device Group
Properties Dialog Box for a Cloud
Properties Dialog Box for a Non-WAN Link
For a Link
Tabs Available for a Non-WAN Link
Tabs available for a link are shown in Table
Tab Title
Connection
Tabs available for a WAN link are shown in Table
Tabs Available for a WAN Link
Selection explanatory text is displayed, as shown in Figure
Tabs available for a link to a subnet are shown in Table
Tabs available for a Layer-3 Connection
Properties Dialog Box for a Multiple Selection
No Common Information Across the Selection
Changing the Comments
Changing the Custom Name
Click OK to save your changes
Setting the IP Address for a Manually Added Device
Addresses Tab for a Manually Added Device
Setting the Port Numbers for a Manually Added Link
Ports Tab for a Manually Added Link
For a Device
Components
Security Tab for a Device
Community Strings Not Accepted
Monitoring tab of the Properties dialog box
Retry/Timeout tab of the Properties dialog box
Retry and timeout settings can be configured from within
4007
How Do I View the Properties of a Specific Port on a Device?
Examples
Properties for a Specific Port
Security Tab for Multiple Devices
How Do I Prevent the Discovery of End-Stations in a Subnet?
There Is No Port Information For My Device
How Do I Restrict Monitoring to Snmp Traps for a Device?
Lot of Fields in the Properties Dialog Box Show Unknown
There Is No General Unit Information For My Device
Key Considerations
Viewing Device Details
Network using 3Com Network Director
When issues arise
Monitor
Monitoring the Network
Color Description
Map Item Color Key
Monitoring State and the Grouped View
Snmp MIB Data Retrieval
IP Ping Monitoring
Snmp Trap Receipt
Service Polling
Monitoring Non-3Com Devices
Components
Poll Rates
Live Graph Display
Displaying Thresholds
Bi-State Monitors State Representation
Live Graphs Toolbar
Detailed Graph Dialog Box on
Live Graphs Monitor Menu
Display thresholds Toggles the forcing of the display
Live Graphs View Menu
Components
Detailed Graph
Viewing a Monitor’s Component Values
Component Values Fields
Showing Thresholds
Exporting a Graph
Showing Plot Points
Graph Save As... Dialog box
Zooming into a Graph
After zooming
Zooming
Performed automatically from the Network Discovery Wizard
Configuration
Disabling and Enabling Individual Monitors
Detailed Graph for Disabled Monitor
Monitoring Mode
Configuration
Poll Rate
Monitoring Tab of Tools Options Dialog Box
Monitoring Tab of Subnet’s Properties Dialog Box
Monitoring Tab of Device’s Properties Dialog Box
Specifying Monitoring Mode in the Discovery Wizard
Monitoring Pane of Network Discovery Wizard
Destination
Monitors event will be generated
Monitoring Tab of Tools Options Dialog Box
Monitoring the Network
Logging Tab of Tools Options Dialog Box
Enabling Monitoring
Network
On the Core Devices
Subnet Selection from Main Window Tree
Properties Dialog Box for a Subnet
Use Defaults Option in Tools Options Dialog Box
Poll Rates in Tools Options Dialog Box
Close the Properties dialog box by clicking OK
Monitor History
Maintained
Minutes
Maintain Monitor History Field Detail
Problems Starting Monitoring for a Device or Link
Monitoring the Network
Error Message Dialog Box
Monitoring the Network
Relevant and concise
Event LOG
Monitor-Based Events
Event Types
Information Severity
Snmp Trap-Based Events
Critical Severity
High Severity Events
Recurring Severity
Event List Color Coding Key
Event Severity Colors
Color Severity
Recurring Event Handling
Event Correlation
Snmp Trap Filtering
Event Suppression
Viewing Unresolved Events for a Selection To view all
Window
Events Window Main Window
Events List
Following table details the columns used in the Events list
Column Heading Contents
Events List Column Headings
Events Menu
Events Toolbar
File Menu Item Hot Key Operation
Edit Menu Item Hot Key Operation
Event Menu
View Menu Item Hot Key Operation
Event Menu Item Hot Key Operation
There are two status bars shown in the Events window
Status Bars
Database Status Bar
Navigating to Event Sources in the Map
Commenting on Events
Comment Dialog Box
Manually Resolving Events
Deleting Events
To stop an update while it is in progress select View Stop
Export as CSV Format Dialog Box
Wildcard Matches Example Example Matches
Wildcards Used in Find Operations
Events List Components
Name Filter
You may filter on any combination of the fields
Severity Filter
Show only voice related events Filter
This field filters for events that have a specific severity
Resolved Filter
Last number of days Filter
Description Filter
Deleted Events Filter
Comment Filter
Filter Status Bar
Text Description
Events Window Filter Status Bar Details
Event tab provides a description of the event
Event Tab
Graphs Tab
Events List Components
Trap Decode Tab
Enabling Events
Disabling
Disabled Events Dialog Box
Selecting Items
Selected Items dialog box
Controlling Global Smart Event Analysis
Advanced Settings Dialog Box
Controlling Snmp Trap Filtering
Smart Event Analysis will be ignored
Controlling Per-Event Advanced Settings
High and Warning Thresholds
Launching the Threshold Settings Dialog Box
Threshold Settings Dialog Box
Threshold Settings Dialog Box
Event System Configuration
Event LOG
Logging Tab
Event LOG
Ageing Dialog Box
Overview
Alerts System
Attach Alerts Dialog
Box
Attach Alerts Dialog Box
Attaching Alerts to Items
Configuring Alerts
Token Replaced In Generated Alert By
Alert System Tokens
Sample Pop-up Alert
Pop-up for a Device
Snmp Trap Alerts
Snmp Trap Alert Options
View relevant events and assist in troubleshooting
Examples
Filter Dialog Box 7 Days of High Severity
Select File Export as CSV
Filter Dialog Box Show
Events Window Updated
Event LOG
Clear the Enable event suppression check box
Problem
Server Farm Is Unreachable
Close the global Advanced Settings dialog box by clicking OK
Add Alert Dialog Box Pager Option
Set Up Alerts Dialog Box
Attach Alerts Dialog Box
Match the configured filter
Events List Update Was Stopped
No Events
Events list
Events List Window Bottom Status Bar
Filter Has Excluded All Events
Options Dialog Box Logging Tab
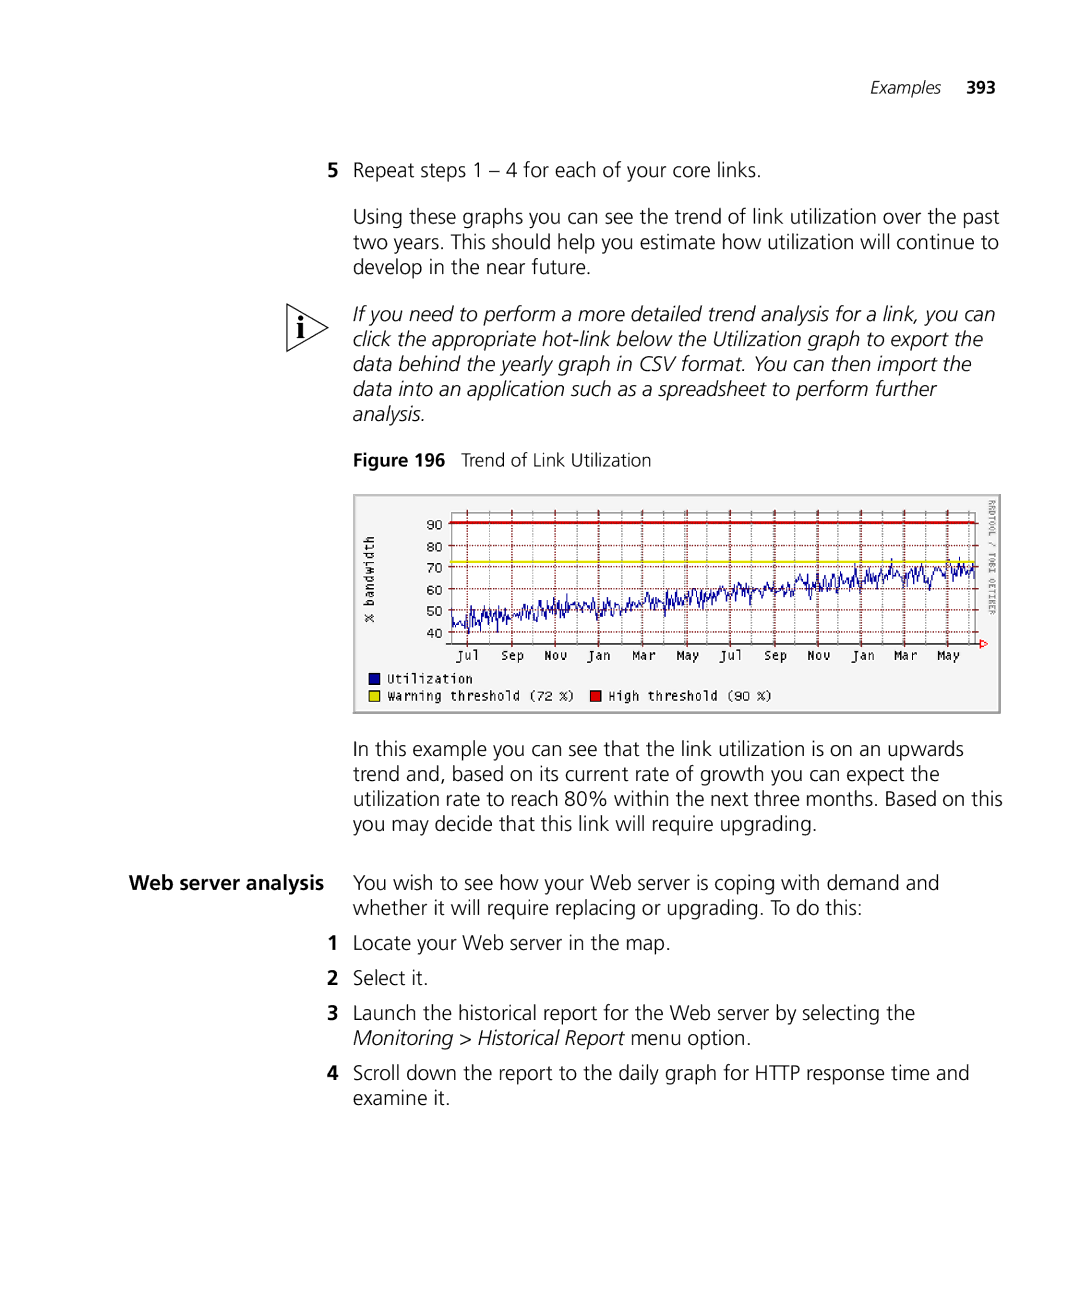
See how network usage changes over a period of time
Performance Reporting
Performance Reporting
Historical Report Example
Resolution Time span
Report Resolutions
Device Monitors
Link monitors
Data Source Usage
Monitor Sub-graphs Comments
Select Tools Options
\Program Files\3Com\3Com Network Director\logging
Requirements
On a link
Trend of Link Utilization
Daily Graph of Http Response Time
Filename, Switch1 MAC address, Switch2 MAC address
Links between switches/hubs
Links between a switch/hub and an end station/cloud
Filename, MAC address
Performance Reporting
Monitor Data source
Link Monitors
Monitored Monitored links Devices Disk space
Disk Space Requirements
Changing the logging data directory
Troubleshooting Mapping file not updating
Navigate to the data\com\coms\wsd\tns subdirectory
Missing data within RRD database files
Key Considerations
Performance Reporting
Standard
Rmon
Statistics
Support provided by 3Com Network Director
History
Following section describes the key concepts of Rmon
HostTopN
Host
Matrix
RMONView window
By 3Com Network Director
File menu
Menu bar
RMONView window
View menu
Options Menu
Options menu
Manual Upload Toggles Manual Upload on/off. If
See Map Item Labels and Address
Update Menu
Update menu
Help Menu
Window menu
Toolbar
Toolbar Buttons
Additional Features
Table Control Dialog Box
Table View
There are three ways to control the display of rows
Viewing data from the Rmon Statistics group
Graph View
Viewing Rmon Statistics data for a selected device
Rmon Statistics Option
Viewing Rmon statistics data for a selected link
Rmon Statistics Slot 5 36 Port 10/100 L2 Switch
Rmon Statistics Data for a Selected Link
Statistics View Dialog Box
Statistics View dialog box
View
Community String
Predefined Views
Predefined View Definition
Viewing Rmon History data for a selected device
Viewing data from the Rmon History group
Rmon History Data for a Specific Device
Viewing Rmon history data for a selected link
Viewing Single Link Lists
History View Dialog Box
History View dialog box
Update Rate
Add, Delete
History Entries
Rmon
Viewing Rmon Host data for a selected device
Viewing data from the Rmon Host group
Host Data for a Specific Device
Viewing Rmon host data for a selected link
Switch 4007 Selection of the Slot within the Chassis
Host View Dialog Box with the Vlan Interface Preselected
Select Vlan Dialog Box
Host View dialog box
Update Rate
Sort by
Error dialog box
Viewing Rmon Matrix data for a selected device
Viewing data from the Rmon Matrix group
Rmon Matrix Data
3Com Switch
Viewing Rmon matrix data for a selected link
Switch 4007 Separate Submenu
Matrix View Dialog Box
Host Submenu
Update Rate
Matrix Flow
Stations
Managing Rmon tables
Interface Dialog Box
Deletion of Rmon Tables
Components
This section describes some Rmon examples supported by 3Com
Errors
How do I graph utilization on a specific VLAN?
Rmon Limits on individual devices for table creation
Rmon Support on individual 3Com devices
Creating Reports
Feature Report Types Covered
Feature Report Types
Open Windows Explorer Navigate to the following directory
Feature Report Types Covered
Types are also available
Properties to use in your own command line scripts
Inventory Report
Capacity Report
Components
Creating Reports
Reports Dialog Box
Generate Report Tab
History
History Tab
CSV format used for exported reports is
Custom Report Types Dialog Box
Add/Edit Report Type Wizard Columns Step
Columns Step
Column Description
Available Columns for Node Details
Column Description
Available Columns for ‘Link Details
Add/Edit Report Type Wizard Name and Description Step
Name and Description Step
Further details
Report types
Assessing Network
Work out which 3Com devices to connect them to
Choose to Place chart As new sheet and click Finish
Creating Reports
Key Considerations
Creating Reports
Administration Menu contains integrated add-on 3Com device
Web Management launches your default web browser against a
Devices on your network for any applicable warranty
Device selected in the network map
Devices using 3Com Network Director
Switch Manager is the element manager of the Switch
3Com Switch Manager
Network Jack Configuration Manager
3Com Device View
Configuring Single Devices
Key Concepts
Properties General Tab
Following two radio buttons are provided
Security
Properties Unit Information Tab
Unit Information
Properties VLANs Tab
Properties VLANs Tab Vlan Routing
Devices as shown in Figure
Introduction Step
Contact Details Step
Partner/Reseller Details Step
Partner/Reseller Details step displays the following fields
Device Selection Step
Summary Step
What Data is Sent to the 3Com server
Web Management
Device Warranty
Device Warranty
Web Interface
Devices on your network
View
Click OK to launch the Device Warranty wizard
Select the device and right-click on it to launch the menu
Examples
Select the Tools Device Warranty menu option
Why are some registered devices missing from the email?
Configuring Single Devices
Configuring VLANs
Configured on your
Viewing the VLANs
On your network
General Vlan
Key Concepts
Concepts About VLANs
Benefits of VLANs
Network Setup Showing Three VLANs
Ieee 802.1Q standard for VLANs aims to
802.1Q VLANs
Port-based VLANs
Tagged and untagged Vlan membership
Communication between VLANs
Example of VLANs Distributed Amongst More Than One Switch
Key Concepts
Primary and Secondary IP interfaces
Switches Connected by 802.1Q Tagged Links
Spanning Tree
Protocol-based VLANs
Discovering VLANs in 3Com Network Director
3Com Network Director Vlan Concepts
Vlan membership inference
For further information see Discovering the Network on
Vlan equivalence
Vlan Matching by 3Com Network Director
Network Example
Restrictions on Vlan support in 3Com Network Director
If the above network was additionally configured like this
Show VLANs
Show VLANs
Interaction with Trace Path
Filter View button
Vlan names
Maps with no Vlan information
Show VLANs Toolbar Vlan Descriptions
Where
Identifier Description
Naming the Vlan
Find Dialog Box
Listing Vlan Members
Options Dialog Box
Options Dialog Box VLANs Tab
Vlan membership
Vlan IDs
VLANs tab for VLAN-aware switches
VLAN-aware switches. See Vlan membership inference on
Ports in Vlan table
Columns in the Ports in Vlan table are
Protocol Details Button
Protocol Details button
Protocol Column
Vlan Routing button
Vlan Routing Dialog Box
Components
VLANs Tab for VLAN-Unaware Devices
VLANs tab for VLAN-unaware devices
VLANs Tab
VLANs Tab for a Link
VLANs tab for a link
Generate Report Dialog Box
Vlan configuration report
Vlan Configuration Report Entry
Misconfigurations and Optimizations Report
Inconsistent Vlan naming
Inconsistent Vlan configuration on link
Inconsistent Vlan IDs
Changes Report
Launching the wizard
Create Vlan wizard
Entering the new Vlan name and ID
Modifying the list of selected switches and ports
Nearest Switch Port to the Non-Switch
Components
Add Ports by Type dialog box
Untagged radio buttons
Checking Vlan connectivity
Vlan Management
Finding a Layer 3 Switch for a Vlan
Checking the Vlan limit
Configuring unsupported devices
Adding an IP routing interface
Manually Configuring a Vlan on Unsupported Devices
Specify an IP Routing Interface
Components
Summary of changes to be made
Device Summary Stage
Creating the new Vlan on the selected switches and ports
Edit Port Vlan Membership wizard
Adding Unconnected Ports
Modifying the list of selected switches and ports
Untagged Vlan
Modifying the VLANs on the selected switch ports
Tagged VLANs
Tri-state Check Boxes
How the changes will be applied
Configuring unsupported devices
Final Wizard Stage
Applying the changes
Device History Report
Moving a port to another Vlan
Selecting the Link to the End Station on the Map
Network Before
Vlan is an existing Vlan on your network Before
After
Extending your VLANs to include new inter-switch links
Selecting the Link
Second Wizard Stage
Creating a new Voice Vlan for 3Com NBX systems
Useful Information References
Incorrect topology if all subnets are not discovered at once
Troubleshooting Incorrect Vlan membership inference
Network Topology Example
Network Topology Example
Switch Switch4400-6 Port 00-30-1e-c6-40-38
Vlan configuration and Display by Device Type
Changes report Vlan configuration consists
Device Type Vlan Display Vlan Configuration
Reference a
Maximum number of VLANs by 3Com device
Reference B
Maximum Number
Device Type VLANs
Device Type
Reference C
3Com devices on the network
More of the 3Com devices in a network in a single operation
Same or different types, in a single operation
Templates
Configuration
Selection
Configuration Editor Dialog Box
Switch Device configuration template
Configuration Summary Tree Features
Switch Port configuration template
Features
Feature Configuration Panels
Configuration Editor Dialog box
Port Selection Editor
Loading and Saving Configuration Templates
Editing Device and Port Selections
Bulk Configuration
Components
Loading and Saving Device and Port Selections
Schedule Configuration Dialog Box
Configuration Progress Dialog Box
Device Status Information
Device Status Configuration Stage
User Account Parameters
Configuring User Accounts
Account Parameter
Account Parameter
Bulk Configuration
Edit User Account Dialog Box
Add User Account Dialog Box
Configuring Trusted IP Hosts
Configuring Access Rights
Trusted IP Hosts Panel
Add Trusted IP Address Dialog Box
Add Trusted IP Address Dialog Box
Radius Servers Panel
Configuring the Device as a Radius Client
Radius servers feature restrictions
Configuring System Information
Parameter Restriction
Configuring Trap Destinations
Parameter Description
Trap Destination Table Entries
Add Trap Destination Dialog Box
Configuring Spanning Tree
Spanning Tree Parameter Restrictions
Spanning Tree Panel
Configuring Broadcast Storm Control
Configuring Igmp
Broadcast Storm Control Panel
Configuring Port Security
Continuous learning, automatic-learning, full security
Configuring Port Administration
Port Administration Panel
Configuring Autonegotiation
Autonegotiation Parameter Restrictions
Autonegotiation Panel
Lacp Panel
Configuring Lacp
This section provides some examples of how to use the Bulk
Configuration feature of 3Com Network Director
Examples
Schedule Configuration Dialog Box
Examples
Configuration Template Editor Radius Servers
Configuration Template Editor Port Security
Select the user-login security mode
Bulk Configuration
Device Family Supported Features
Bulk Configuration Feature Summary
Device Family
Key Considerations
Bulk Configuration
Dropped in times of congestion
Network traffic on the 3Com devices on your network
Over your network
Classification
Key Concepts
Network Topology
Key Concepts
Queue Servicing Mechanism
Classification Rules Service Level
DiffServ Codepoints
Service Level DiffServ Codepoint
DiffServ Codepoints and Service Levels
Manually set up classifiers, dropping, queuing and marking
Classification Rule Service Level
Prioritize Network Traffic Wizard Configuration Type
Configuration Type Step
NBX Step
NBX step
Servers Step
Prioritize Network Traffic Wizard Applications
Applications Step
Application Field Values
Finish Step and Progress
Agent Upgrades Required for Prioritization report
Network Prioritization Report
Prioritization Configuration Report
Configuration
Configuration Type Prioritizing NBX Voice Traffic Example
Prioritizing Network Traffic
Examples
Prioritizing Network Traffic
Examples
Prioritizing Network Traffic
Examples
Servers Restricting Access to Snmp Example
Examples
Prioritizing Network Traffic
Applications Restricting Access to Snmp Example
User Priority
User Priority
RFC Number Title
RFC Definitions
NBX Phone Traffic Classifier Rules
Traffic
Classifier Type Classifier Value Description
Service Levels Used by 3Com Network Director
3Com Network Director Service Levels
Service Level Queue Marking Value Queue Device 802.1p
Device Type Agent Version
Key Considerations
Resource Warning Content Explanation if appropriate
Key Considerations
Servers That Cannot Be Selected for Blocking
Key Considerations
Prioritizing Network Traffic
Upgrade or downgrade the agent software on individual 3Com
You can use the Agent Update feature to
Agent software available to you
Agent software you have available
Feature
Agent Update Wizard Introduction
Agent Update Wizard Update Type
Update Type Step
Specify Devices and Agent Versions Step
Agent Update Wizard Specify Devices and Agent Versions
Upgrading Device Software
Change Agent Version Step
Agent Update Wizard Change Version
Scheduling Step
Agent Update Wizard Scheduling
Summary Step
Progress Dialog Box
Agent Update Wizard Progress Dialog Box
Reports Agent Update Summary report
Agent evening. To do this
Agent Audit report
Problem Device
Device Family Agent Filename Format
Agent Filename Format by Device Type
Device Problems
Troubleshooting
Update
Co-existence With
Default location of 3Com Network Director is
TIMEOUT,/TIMEOUT
Upgrading Device Software
Local and Remote Sites
Monitor and manage multi-site networks
Issues with Managing a Multi-Site Network
Configurable Timeouts
Configurable Retries
Configurable Monitoring Modes
Configurable Poll Rates for Active Monitoring
Configurable Monitor Thresholds
Configurable Discovery Options
Default WAN cloud
Connecting Point-to-Point WAN Interfaces Together
Grouping Logically Connected WAN Interfaces Together
Using 3COM Network Director on a MULTI-SITE Network
Components
Manual Layout of WAN Topology and Rediscovery
Configuring WAN Link Monitors
Disabling Monitors on WAN Links
There is a three level hierarchy in this mechanism
Using 3COM Network Director on a MULTI-SITE Network
Specifying Retries and Timeout Periods at the Subnet Level
Retry/Timeout Tab
Specifying Retries and Timeout Periods at the Device Level
Using 3COM Network Director on a MULTI-SITE Network
Determining Appropriate Retry and Timeout Periods
Using 3COM Network Director on a MULTI-SITE Network
Default Number Request Type Retries Default Timeout Period
Retry and Timeout Defaults
Using 3COM Network Director on a MULTI-SITE Network
Configuration
Determining Monitoring Modes and Poll Rates
Configuration
Using 3COM Network Director on a MULTI-SITE Network
Configuration
Configuring Discovery
Configuring Discovery Options in Multi-Site Networks
Configuration
Using 3COM Network Director on a MULTI-SITE Network
Scheduling Discoveries in Multi-Site Networks
Using 3COM Network Director on a MULTI-SITE Network
Examples
Click Find
Find Dialog Box Default WAN
Examples
Adding a Cloud by Drag and Drop
Properties Dialog Box General Tab
Map Links Selected
Map Router and New Cloud Selected
Select one of the routers and the new cloud in the map
Map Router and New Cloud Linked
Properties Dialog Box Ports Tab
Map Showing Labelled Cloud
Map Showing Multiple Links
Rediscovered Map
Finally, relayout the map by selecting View Relayout Map
Examples
Discovery Type step select Specify subnets
Default Retry and Timeout Settings
Network Discovery Wizard
Add Subnet Dialog Box
Add Subnet Dialog Box Subnet Address and Mask
Add Range Start
Add Subnet Dialog Box Discover Custom Ranges Selected
Add Subnet Dialog Box End IP Address Edited
Add Subnet Dialog Box Use Defaults Option Unchecked
Add Subnet Dialog Box Retries and MS Timeouts
Network Discovery Wizard Subnet Added
Network Discovery Wizard Monitor Core Devices and Links
Click Next to move onto the Discovery Options step
Click Next to move onto the NBX Call Processors step
Network Discovery Wizard Discovery Options
Network Discovery Wizard Use Defaults Unchecked
Network Discovery Wizard Only IP Devices Checked
Find Dialog Box
Find Dialog Box Fields Populated
Map Zoomed to Search Results
Weekly Graphs 30 Minute Average
Smtp Response Time
Threshold Settings Dialog Box
WAN Family ifType
WAN Interface Types
Isdn
25lapb16 X25ple40 X25mlp121 X25huntGroup122
Key Considerations
Using 3COM Network Director on a MULTI-SITE Network
Provides the following features
Solutions
Topology The NBX Call Processors, line cards and phones are
Displayed on the 3Com Network Director network map
Shows the different types of icons and their meaning
Icons
NBX Map Icons
Device Type Icon Example
Line Cards
NBX Call Processor
NBX Applications
NBX Phones and Attendant Consoles
Discovering the NBX Voice Network
NBX Call Processors Step of the Network Discovery Wizard
NBX Call Processors step displays the following settings
Add NBX Call Processor
Add NBX Call Processor/Modify NBX Call Processor
Modify NBX Call Processor
Monitoring a Phone
Monitoring the NBX Call Processor
Monitoring a Line Card
Selecting the Phones Associated with an NBX Call Processor
Context Menu for the NBX Call Processor
Context Menu for the Phone or Line Card
Events related to the NBX Call Processor
Understanding Voice-related 3Com Network Director Events
Events related to other links or devices on the network
Events related to phones
Launching NetSet for a phone or line card
To be informed immediately when any of the phones become
When my Phones
Stop Working
Unavailable
Useful Information References
There is no NBX Call Processor associated with this device
There is no NBX Call Processor associated with my phone
Phone was added manually
Display of end stations in the map has been disabled
Phone is not managed by the NBX Call Processor anymore
NBX Support
Key Considerations
Phone was removed from the network
Why are there a lot of unconnected phones on the map?
Phone cannot be reached
How do I change the label of a phone or line card?
Save the software configuration of your 3Com devices
You can use Backup, Restore and Setup to
Device from which it originated or to a replacement device
Same type
Physical Configuration Devices
Backup feature is designed to help you store the software
Source device it is replacing
Backup Type Step
Device Backup
Wizard
Device Backup Wizard Backup Type
Specify Telnet Login Information Step
Specify Devices to Backup Step
Backup Identification Step
Username and password may be left blank
Device Backup Wizard Backup Identification
Summary Step and Progress
Scheduled Tasks
Reports Backup Summary Report
Backup Audit report lists the following
Backup Audit Report
No Backups Found Step
Specify Device Being Replaced Step
Device Restore Wizard No Backups Found
Specify Backup to Use Step
Device Restore Wizard Specify Backup To Use
Summary Step and Progress
Backing UP Device Configurations
Specify Source Device Step
Configuration Source Type Step
Device Setup Wizard Specify Source Device
Specify Source Backup Step
Device Setup Wizard Specify Source Backup
Specify Devices to Setup Step
Device Setup Wizard Specify Devices To Setup
Device Setup Wizard Summary
Backing UP Device Configurations
Backup Identification Example
Scheduling a Device Backup Operation
Scheduling Example
Examples
Specify Device Being Replaced Example
Specify Source Device Example
Backing UP Device Configurations
Shown in Backup, Restore and Setup on
Device Family Supported Parameters
Supported Parameters by Device Family
Device Family Content of Backup File Body Section
Backup File Content by Device Family
Install LOCATION\backups\lost
Key Considerations
Backing UP Device Configurations
Advantage of the latest bug-fixes and device support
Manages the download of these files
Existing devices
Latest 3Com Product News notifies you of new 3Com products
This section describes the keys concepts of Live Update
Connection Type Step
Live Update Setup
Use Custom Settings Step
Live Update Setup Wizard Use Custom Settings Step
Live Update Setup Wizard Summary Step
Box
Click Finish to connect to the Internet
Status
Live Update Select File Groups
Table consists of three columns as follows
File Group Details
Live Update Select File Groups Group Name
Download Progress
Live Update
Options Internet
Live Update
To view the report Select the Tools Reports menu option
Examples
File Group Details Example
Click OK to validate the changes
Automatic Configuration Example
Solution 2 Manual Configuration using the Options Dialog Box
Live Update
Proxy Settings are not Retrieved
Click OK to validate the settings
Key Considerations
Live Update
Device Type Minimum Agent Version
Versions
Device Type Version
Vlan Configuration
Agent Versions
Setup are shown in Table
Restrictions Backing Up and Restoring 3Com Devices
Backup, Restore and Setup
Appendix a Supported Devices
Agent Update Supported 3Com Devices and Minimum Agent
Shows the devices that are supported by the Agent Update
Restrictions Updating 3Com Agent Software
Agent Update
Appendix a Supported Devices
Rmon Supported 3Com Devices
Rmon
Device View Supported Devices
Devices supported by Device View are listed below
Supported Devices
Device View
Device Warranty Supported Devices
Switch Manager Supported Devices
Router Manager Supported Devices
Device Warranty
On the Network Director map as Generic IP devices
Compatibility issues with 3Com Network Director
3COM Device View
Support Matrix
Management features that are available
Management Support Matrix
PWR
Technical solutions written by 3Com support engineers
Registration, Repair Services, and Service Request
Support information
You will find support tools posted on the 3Com web site at
Details about recent configuration changes, if applicable
Diagnostic error messages
From 3Com or your reseller
Benefits, you must first register your product at
Telephone Technical Support and Repair
US and Canada Telephone Technical Support and Repair
System Requirements
Allow approximately 2Mb per device for data logging
Report Examples
Discovery Report
Example
Following devices have been configured into multiple
Vlan configuration of the following devices could not be
Segment configuration of the following devices could not be
Following devices stopped responding while 3Com Network
Appendix E Report Examples
Device Learned On Learned By Multiple Ports Ports Learned On
Listings of the devices are provided as described
Network Configuration
Network Configuration
Misconfigurations Optimizations Report
Misconfigurations and Optimizations Report
Appendix E Report Examples
Configure aggregated links using Lacp
Web Cache Redirection
Misconfiguration and Optimization Reports
Misconfigurations and Optimizations Report
Appendix E Report Examples
Misconfigurations and Optimizations Report
Appendix E Report Examples
Misconfigurations and Optimizations Report
Unsuccessful Configuration
Successful Configuration
Unable to Confirm Webcache Mode Changed
Unable to Determine Traffic Server Status
Traffic Server Restart Already Under Way
Cache Mode Not Changed
Unable to Restart Webcache Traffic Server
Redirection on the Cache Port
Limitations Webcache Redirection and VLANs
Webcache Software Releases
Restarting Webcache Traffic Server
Report Section Combinations
3rd Party Devices
Appendix E Report Examples
Adding Trap Decodes
Where the fields are as follows
RemedyRemedy Text/remedy
885
Appendix F Adding Trap Decodes
Translations
000102 3Com 3COM Corporation
889
Appendix G Adding MAC Address Vendor Translations
Locate the following file on your disk
Integrating AN SSH Client
MyClient -ip %1% -verbose
Index
Backup summary report
Broadcast storm control configuring
490
386
Page
Page
Internal 321
Examples
Deleted events
How backup files are discarded discarding backup files
Map 204 Links Finding 197
Page
Files 64
NBX
New
Page
Properties dialog box 229
786 Backup summary Changes 133
Page
Backup 783 Search
Support for Rmon 407 supported 3Com devices
Third party devices 142 threshold settings dialog box
Viewing VLANs 188 499 Visio
General concepts 500
Page
3COM END User Software License Agreement
Governing LAW