ML2430A Series Power Meter
Warranty
Safety Symbols
For Safety
Page
Table of Contents
Procedures
Gpib Operation
Appendix C Menu Maps
Appendix a Specifications
Appendix B Gpib Quick Reference
Index
Related
1SCOPE of this
Introduction
Manuals
Identification Number General
Information
Sensors
Universal Power Sensor
Information
6SENSORS
Sensor Accessories
Sensors General
Inspection
Power
Initial
Sensor
Power Requirements
Installation
Environmental
Installation
Environmental Requirements
Rack Mounting
Rack Mounting
Or Right Option
Rack Mounting
2ML2430A-03 Rack Mount Kit Parts List
Installation
Rackmount Side Bracket MULTI-FIT
Replacement
Battery CHARGING, Removal and Replacement
7BATTERY
Charging
Installation Battery CHARGING, Removal and Replacement
8STORAGE
Storage and Shipment
Shipment
Anritsu Service Centers
Storage and Shipment
Front Panel
Connectors
Calibrator 0.0 dBm Reference
Connections
Rear Panel Connectors
3REAR Panel
Rear Panel Connectors
Operation
Page
Chapter Front Panel Operation
Front Panel Controls
Operation
3POWER-ON
POWER-ON Procedure
Procedure
POWER-ON Procedure
Sensor Menu
Setup
4SENSOR Menu
Sensor Menu
Calfactor
Deletes the currently displayed table number
+/- key on the numeric keypad allows selection of a user
Averaging
Select OFF, LOW, MEDIUM, or HIGH, Low Level Averaging,
Offset
Rng Hold
Duty cycle
RGH
Channel Menu
5CHANNEL Menu
Channel Menu
If fail Beep is on and Fail Hold is ON, whenever the limits
Trigger Menu
6TRIGGER Menu
Trigger Menu
External
Shows a typical arming diagram
Ranges 1
Sample Trigger in Graphic Mode
System Menu
7SYSTEM Menu
System Menu
Profile
Power vs. Time Source sweep
NORMAL, Min&Max, Min, or Max
Active Cursor Average Reading
Between Cursors
Source Sweep mode
Clear
String can only be defined over the Gpib
Print
Battery
Print
Rear Panel
Sets the Gpib address and emulation modes
Modem
Port
Printer Prnsel
CAL/ZERO Menu
8CAL/ZERO Menu
CAL/ZERO Menu
Measurement
Zeroing
Sensor Calibration
Procedures
4SENSOR Calibration
Sensor ZERO/CAL
Procedures
Sensor ZERO/CAL
Performance
Printer Connection
7PRINTER Connection 8GPIB Remote Operation
Serial Remote Operation
9SERIAL Remote Operation
RS232 Modem Support
10RS232 Modem Support
RS232 Modem Support
Connected Device Character Sequence
Command Definition
Example
Disconnect from power meter and wait for limit failure
Profile Operation Mode
Profile Operation Mode
Typical Setup
Profile Operation Mode
Triggered
Gersetupmode
Measurements
Profile Operation Mode
Setup Options
12SOURCE Sweep
Source Sweep Mode
Mode
Frequency Sweep
Source Sweep Mode
Power Sweep Mode
Mode
13POWER vs
Time Mode
Time Mode
14USER CAL Factors
User CAL Factors
Eeprom
Readout Mode
User CAL Factors
15OPTIMIZING
Optimizing Readings
Readings
Send fast mode on Send0, 13, Fast ON, 7L, NLend
Optimizing Readings
216
Maintenance
Operator Maintenance
16OPERATOR
Related Com
Typographic
Conventions
3DATA I/O
Gpib Operation
Data I/O Formats
Suffix Multipliers Suffix Units
Gpib Operation
Data I/O Formats
Arbitrary Ascii
Query Commands
Arbitrary Block
5GPIB PC Card
Gpib PC Card Setup
Setup
Gpib Device Template
Using 488.1 Gpib
6USING 488.1 Gpib
7USING 488.2 Gpib
Using 488.2 Gpib
Format
Using 488.2 Gpib
OPC
8SERVICE Request
Service Request Status SRQ
Status SRQ
Groups
Functional Groups
9FUNCTIONAL
Gpib
Functional
Custom
Commands
ML24XXA Native Commands
10ML24XXA Native
ML24XXA Native Commands
Related
Example
Syntax *OPC?
RST
Related Commands *SAV
RCL
Syntax *RST
Syntax *STB?
Related Commands *RCL
Syntax *SRE?
Syntax *TRG
Returned String
Related Commands
Query
Mode
Returned
Syntax Avgm s
Avgll
Avgm
Bauts
Power This parameter can be changed for later use
State Enable or Disable
Battery Auto shut off after x minutes
Gpib response buffering enabled
Cfadj
Syntax CAL s
Cfcal
Examples
Value
Source
Cal factor
Related Commands Cfval
Related Commands Cfusav
Cfuct
Cfuid
Cfuld
Cfupt
Binary data
Cfurd
Cfusel
Syntax Cfusav
Cfutbl
Cfuvld
Cfval
Chres
Chcfg
Chcfg 1,A-B
Chunit
CUR
Cont
Cursor Fval
Query CURLK?
Curlk
State on OFF
Cvspf
Cvstv
Cvstf
Dblght
Query DBLTIM?
Related Commands Dbltim Query DBLGHT?
Dbltim
Dcont
Syntax Dcontu
Mode a B A&B
Syntax Dcontd
Query DISP?
Duty cycle 0.1 to 100%
Query DPEAK?
Query DTRGD?
Example Duty A,50
Dutys
Related Commands Dutys
Related Commands Duty
Emul
Syntax Errlst
Query ENTERR?
Errlst
ABCDEFGHIJKLMNO!PPPPPP!QQQQQQ
Fast
Fbeep
Related Commands Fhold
Related Commands Fbeep
Fhold
Frst
Froff
Query FROFF?
Syntax Frst
Syntax Gprst
Related Commands Grpix
Related Commands Grdrq Query GRAVG?
Syntax Grauto
Query GRDDT?
Related Commands Grdrq Query GRDATA?
Syntax Grdrq
Grmd
Grfs
State
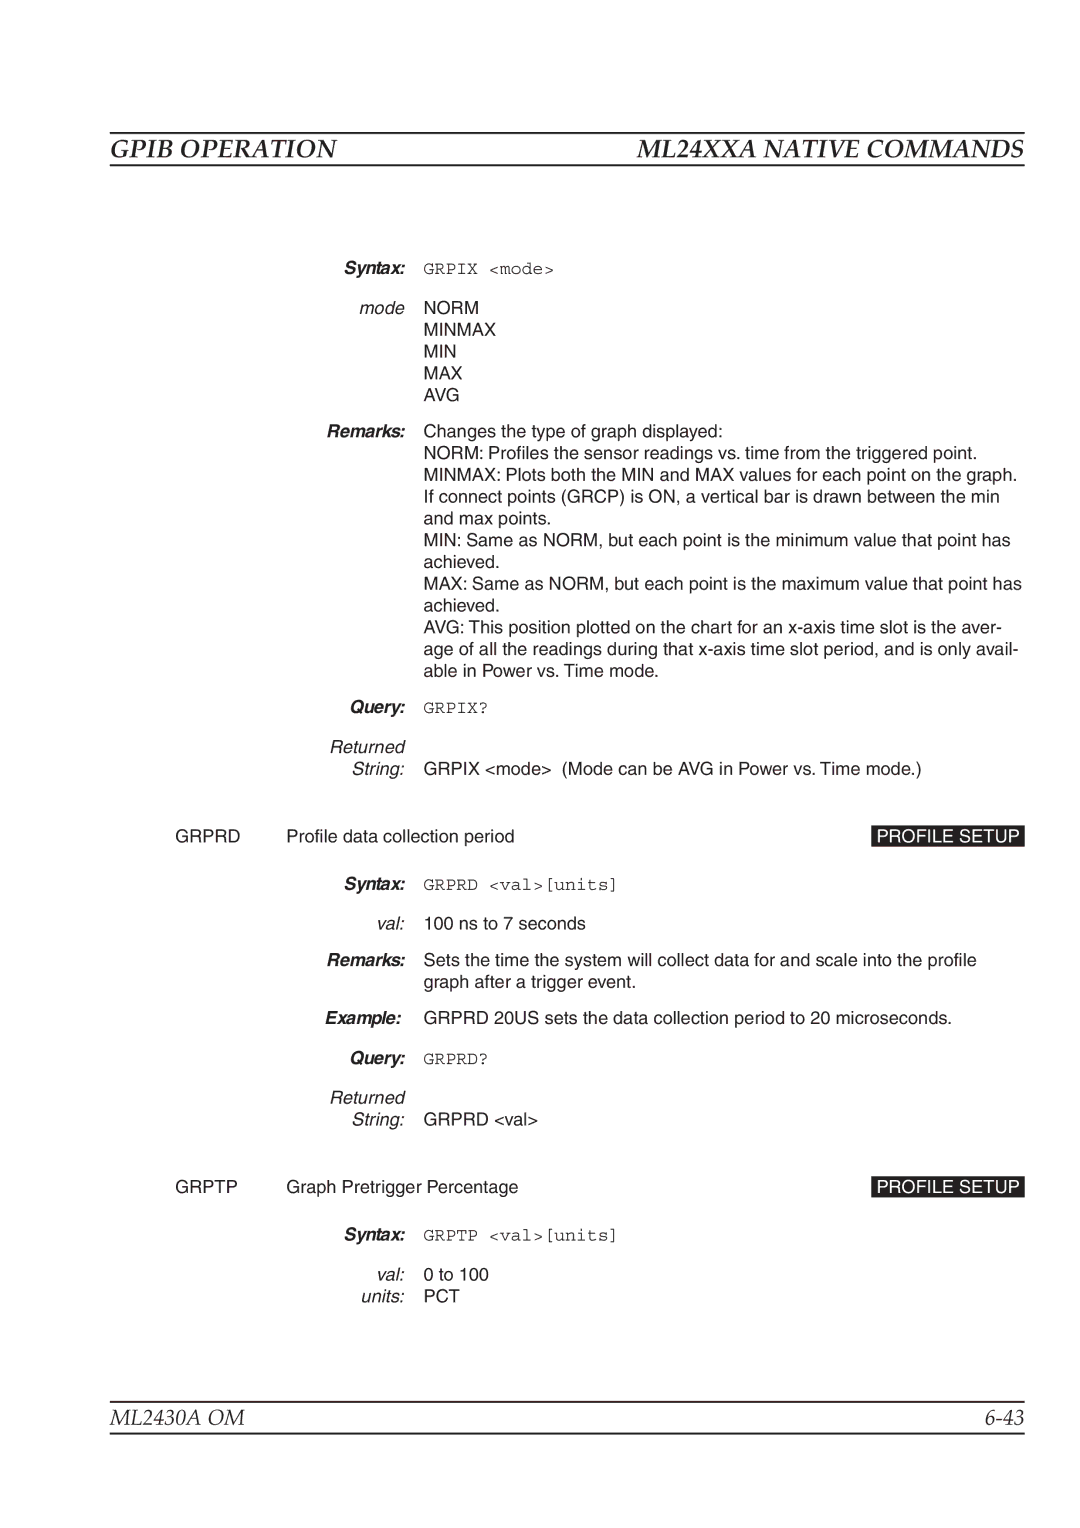
Grpix
Graph after a trigger event
Profile data collection period
Val Ns to 7 seconds
Returned String Grprd val
Query GRPTP?
Related Commands Grswp
Syntax Grswr
Query GRSWS?
Related Commands Mmrst Query GRTMM?
Query GRYB?
ML2430A Series will ignore the GET command or a *TRG
Time mode can also use dB V or dBmV
Mon command
Set GET command to TR1 type immediate trigger
Query GTDLY?
Query GTARM?
Query GTGW?
Gtsrc
Query GTLVL?
Query GTSRC?
Type Rise Fall
Related Commands Gtsrc Query GTXTTL?
Query GTTYP?
Hlims
Related Commands Hlims
Related Commands Hlim
Hold
Query IBBLP?
Related Commands OGD, Ogbd Query HOLD?
Query KEYCK?
Llim
Related Commands Llims
Query LINK?
Llims
Mngdb
Related Commands Llim
Mmrst
Mngd
Query MODDEL?
Related Commands Mmrst
Value 1 to
Syntax Modinit
Number Text
Query MODLIM?
Modph
Modpwr
Query MODRNG?
Count 0 to
Query MODRED?
Syntax Mxgdb
Obacm
Syntax Mxgd
Syntax O c
Query OBACM?
Port 1 or 2 units W Watts
Port 1 or
Obdsp
Obdst
Changes the type of output selected for the BNC outputs
BNC output mode select
Returned String Obdst port,units,val
Returned String Obmd port,mode
Query OBZL?
Offfix A,-47DB
Offfix
Offtbl
Offtbu
Offtbr
Val Bytes
Offval
Offtyp
Type OFF Fixed Table
Ogbd
Ogsd
OGD
Syntax OGD
Syntax Ogsd
Example on 1
Mode Digit Profile Pwrtim Srcswp
Related Commands Grmd Query OPMD?
Opmd
Query PRNSEL?
Prnsel
Type HP340 BJC80
RCD
Rfcal
REL
Query RFCAL?
Query RSBAUD?
Query RSMODE?
Senmm
Query SECURE?
Senmo
Sentyp
Mode Freq Power
Senstl
Query SRCMOD?
Syntax Srcstat
Power Value
Freq value
Syntax Start
Power Value power
Syntax Status
Gpib Operation
Sysld
Sterr
Syntax Sterr
Store number 1 to Data length
Store number 1 to
Related Commands Sysrd
Sysrd
Related Commands Text Query TEXTS?
Related Commands Sysld
Related Commands Texts Query TEXT?
Syntax TR0
TR2
TR1
Syntax TR1 c
Syntax TR2 c
Syntax TR3
TR3
Trgdly
Ger data
Val To 1.0 seconds
Time the system waits after a trigger event has happened
Trglvl
Mode IND Comb
Rise Fall
Trgtyp
Type
Trgxttl
Syntax Vzero
Vzero
Syntax Zero s
Modes
Gpib Emulation Modes
11GPIB Emulation
Zeroing a Sensor
Emulation
ML4803A Emulation Commands
12ML4803A
SRQ’s
AVE
ML4803A Emulation Commands
PCT VSW RDB DBV50 DBV75 VLT50 VLT75
Number
COF
CCA
CDJ
COS
MCC
MCA
Mem
MCO
MDI
MCR
MCT
MEN
MRF
ODT
OMR
OI?
Syntax OI?
Syntax OMRmem
Contents
OPW
Examples, dBm Mode and Watt Mode
RNG
SRQ
WAT
STA
ZAJ
HP 436A Emulation Commands
13HP 436A
HP 436A Emulation Commands
Trigger without settling
2 3 4 5 6 7 E 10 11 CR LF
Range
HP 437B Emulation Commands
14HP 437B Emulation
HP 437B Emulation Commands
Logical or
Syntax *TST?
Syntax @1val
Related Commands Sterr
Related Commands RV
Examples CL98.5EN
Syntax DA
Related Commands DE, DF
Table number 0 to
Syntax DD
Syntax DE
Related Commands DD, DF
Related Commands DD, DE
Syntax DF
Syntax EN
Syntax EX
Related Commands FH, FA
Related Commands FM, FH
Related Commands FM, FH, FA
Syntax FA
Syntax GTmode
Syntax LG
Terminator %
Example KB99.9%
Example LH30.00EN
Syntax LN
Syntax OD
State OFF
Preset the unit
Recall setup
For example OF1 Turn offsets on
Table number 0 to Cal factor 50 to 150 % terminator
Syntax RH
Syntax RLmode
Mode 0 1
Related Commands RH
RM3EN
Syntax SM
Syntax SNval
Syntax SV
Related Commands RC
ST2EN
Syntax TR1
Syntax ZE
15HP 438A
HP 438A Emulation Commands
?ID
HP 438A Emulation Commands
Related Commands DE
CL98.5PCT
Related Commands DD
Syntax DRval
Related Commands TR
Examples KB99.9%
Syntax OI
Syntax PR
Syntax RA
ML2430A OM 125
126 ML2430A OM
ML2430A OM 127
Examples
Programming Examples
16PROGRAMMING
Output Data
Programming Examples
Get Graph Data
Register zation
It is the ML2430A, read back value
General Send
Receive System
132 ML2430A OM
ML2430A OM 133
134 ML2430A OM
ML2430A OM 135
Specifications
System
System Specifications Appendix a
Vswr
Triggering
System Specifications
Setup
Save/Recall
Age
Output Range Resolution
Cal Factor Volt
Input
EMI
System Defaults Appendix a
3SYSTEM Defaults
System Defaults
Trigger
System Defaults Appendix a
EXT Comms
CAL/ZERO
4SYSTEM Error
System Error Messages
Messages
System Error Messages Appendix a
ML24XXA Quick
Reference
ML24XXA Quick Reference
Appendix B
Appendix B
ML24XXA Quick Reference
Table B-9.Profile Setup Functional Group Commands
Table B-11.System Functional Group Commands
Query Returned String
MODLIM?
REL C,MODE RFCAL? Rfcal State
ML4803A Quick Reference
ML4803A Quick
HP 436A Quick Reference
4HP 436A Quick
HP 437B Quick Reference
HP 437B Quick
HP 437B Quick Reference
Trigger immediate 115 126
HP 438A Quick Reference
6HP 438A Quick
HP 438A Quick Reference
HP-IB Support
HP 437B Commands
7HP-IB Support
HP-IB Support
LM1
HP 438A Commands
ML2430A OM 19/B-20
Menu Maps
Sensor Menu
Appendix C
CFUUSE, Cfuvld
Appendix C
Offset
Duty cycle
Channel Menu
Readout display and channel 2 at the bottom
Hlims
4TRIGGER Menu
Trigger
System Setup
5SYSTEM Menu
Units are dBmV or dBV if
Or dBV respectively
Print
Battery
Modpwr
Secure
ML2430A OM 15/C-16
Blanking BNC
Ascii
Beep
CD ROM Edit
ISA
GET
Post
Setup
Reset
Warranty
RAM