Figure 7 - 2 Cable Diagnostic window
Enter the port number you wish to test and click Test, the results will be display on the lower half of the table.
CPU Utilization
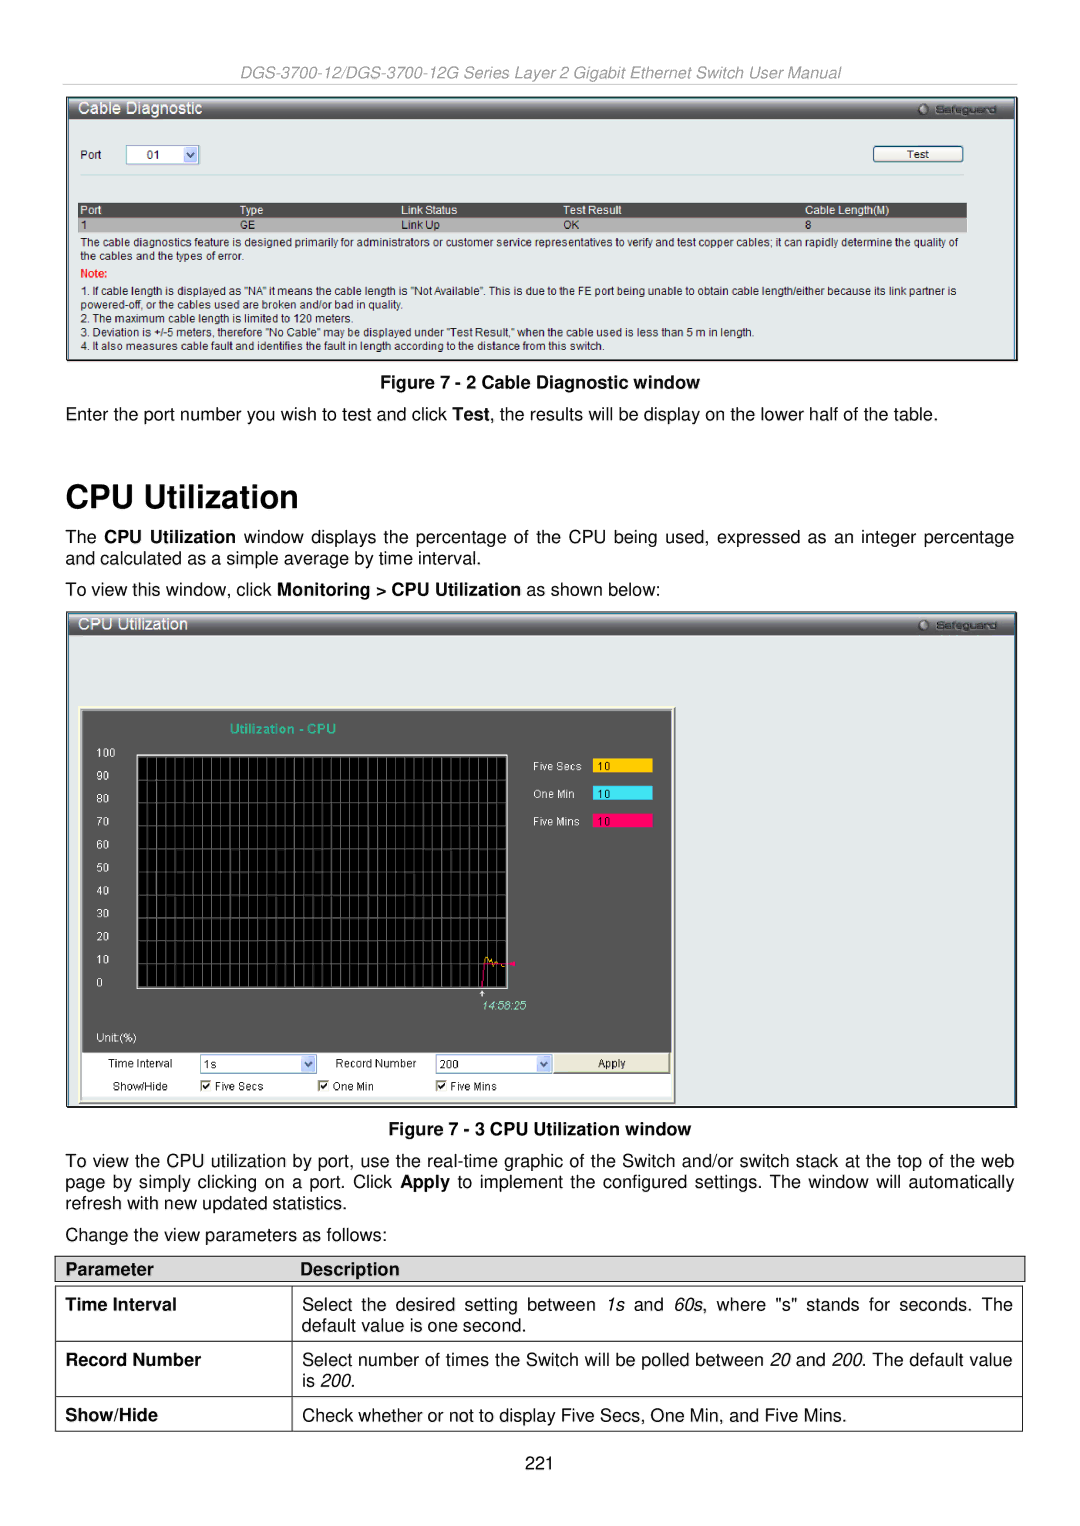
The CPU Utilization window displays the percentage of the CPU being used, expressed as an integer percentage and calculated as a simple average by time interval.
To view this window, click Monitoring > CPU Utilization as shown below:
Figure 7 - 3 CPU Utilization window
To view the CPU utilization by port, use the
Change the view parameters as follows:
Parameter | Description |
|
|
Time Interval | Select the desired setting between 1s and 60s, where "s" stands for seconds. The |
| default value is one second. |
Record Number | Select number of times the Switch will be polled between 20 and 200. The default value |
| is 200. |
Show/Hide | Check whether or not to display Five Secs, One Min, and Five Mins. |
|
|
221