|
|
| ||
|
|
|
| |
|
|
| (excluding framing bits but including FCS octets). | |
|
|
|
| |
|
|
| The total number of packets (including bad packets) received that were between 65 and | |
|
|
| 127 octets in length inclusive (excluding framing bits but including FCS octets). | |
|
|
|
| |
|
|
| The total number of packets (including bad packets) received that were between 128 and | |
|
|
| 255 octets in length inclusive (excluding framing bits but including FCS octets). | |
|
|
|
| |
|
|
| The total number of packets (including bad packets) received that were between 256 and | |
|
|
| 511 octets in length inclusive (excluding framing bits but including FCS octets). | |
|
|
|
| |
|
|
| The total number of packets (including bad packets) received that were between 512 and | |
|
|
| 1023 octets in length inclusive (excluding framing bits but including FCS octets). | |
|
|
|
| |
|
|
| The total number of packets (including bad packets) received that were between 1024 and | |
|
|
| 1518 octets in length inclusive (excluding framing bits but including FCS octets). | |
|
|
|
| |
| Show/Hide |
| Check whether or not to display 64, | |
|
|
| packets received. | |
|
|
|
| |
| Clear |
| Clicking this button clears all statistics counters on this window. | |
|
|
|
| |
| View Table |
| Clicking this button instructs the Switch to display a table rather than a line graph. | |
|
|
|
| |
| View Graphic |
| Clicking this button instructs the Switch to display a line graph rather than a table. | |
|
|
|
|
|
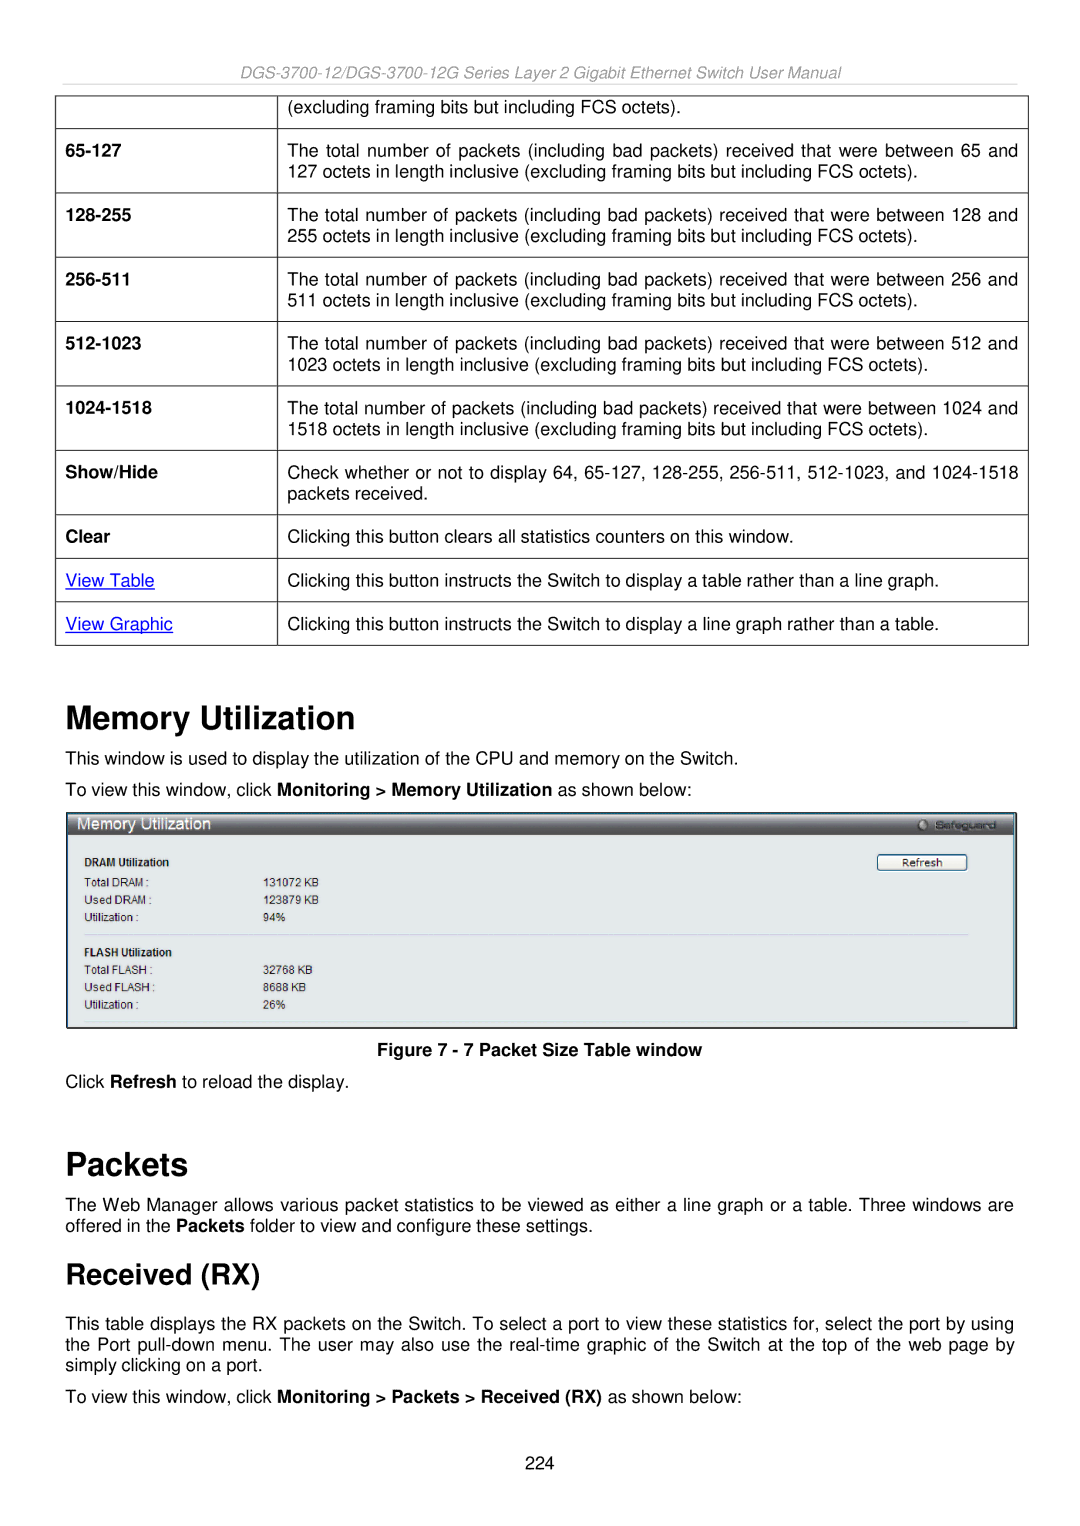
Memory Utilization
This window is used to display the utilization of the CPU and memory on the Switch.
To view this window, click Monitoring > Memory Utilization as shown below:
Figure 7 - 7 Packet Size Table window
Click Refresh to reload the display.
Packets
The Web Manager allows various packet statistics to be viewed as either a line graph or a table. Three windows are offered in the Packets folder to view and configure these settings.
Received (RX)
This table displays the RX packets on the Switch. To select a port to view these statistics for, select the port by using the Port
To view this window, click Monitoring > Packets > Received (RX) as shown below:
224