Errors
The Web Manager allows port error statistics compiled by the Switch's management agent to be viewed as either a line graph or a table. Four windows are offered.
Received (RX)
To select a port to view these statistics for, select the port by using the Port
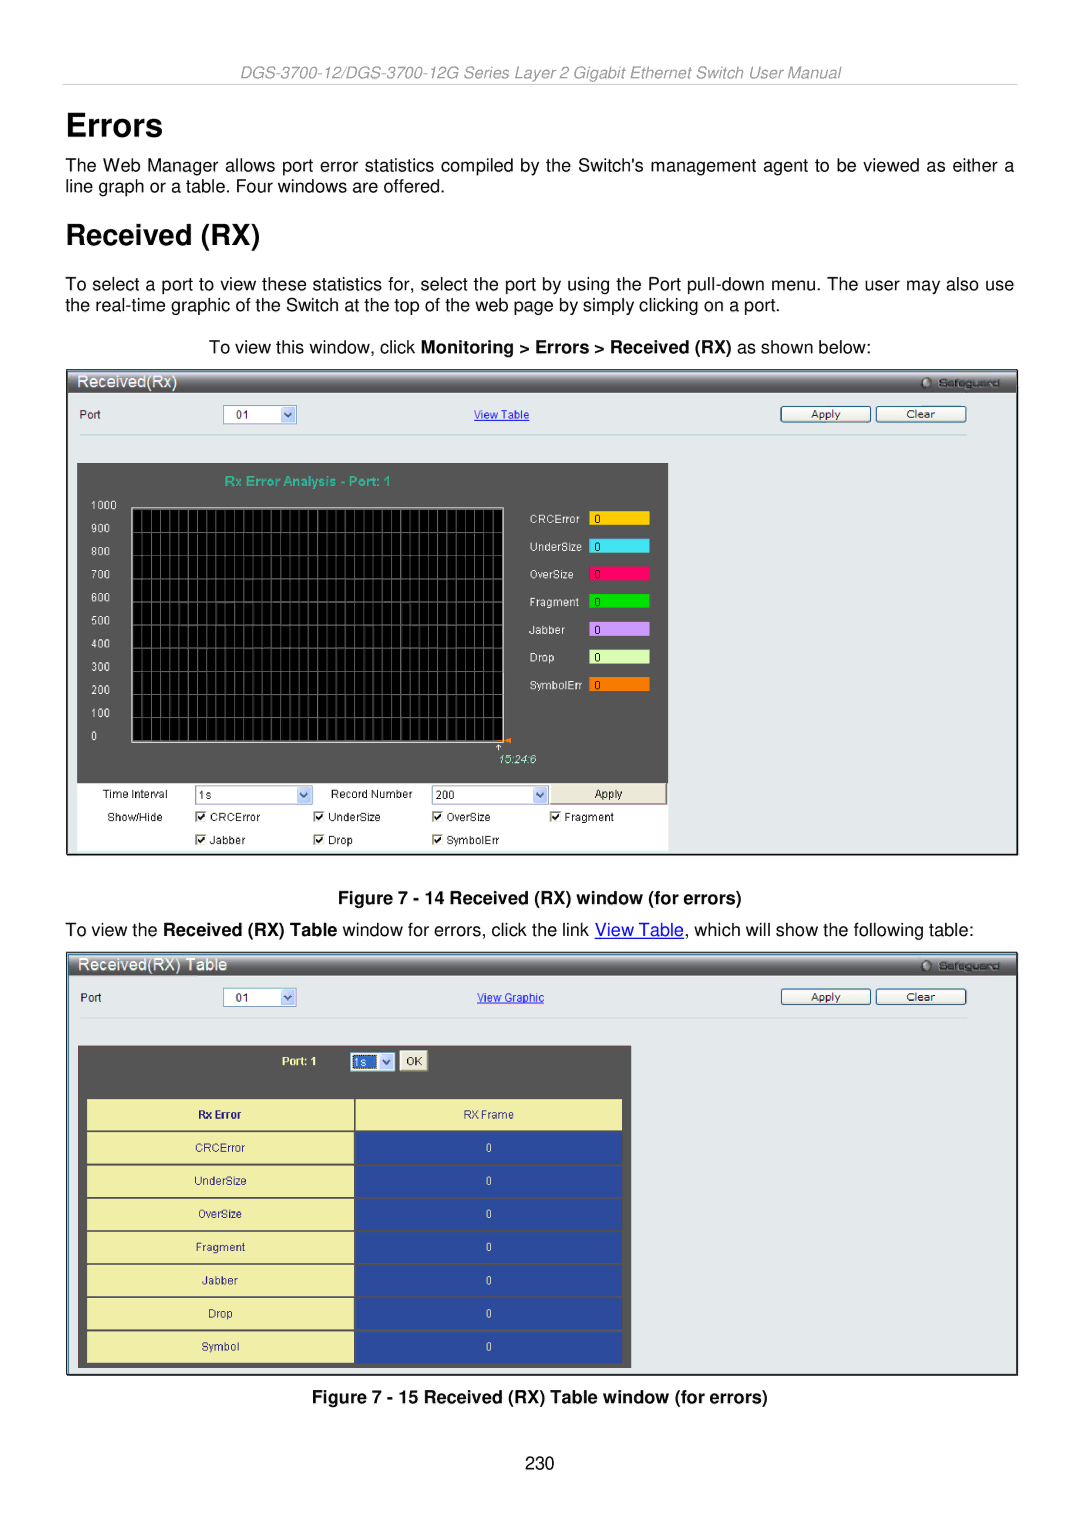
To view this window, click Monitoring > Errors > Received (RX) as shown below:
Figure 7 - 14 Received (RX) window (for errors)
To view the Received (RX) Table window for errors, click the link View Table, which will show the following table:
Figure 7 - 15 Received (RX) Table window (for errors)
230