Browse Historical Utilization
This window displays information regarding the historical utilization of the CPU and memory. The counters are set up in 15 minute and one day intervals. There is a maximum of five 15 minute historical utilization entries supported for each port, with one being the most recent 15 minutes of data. The Switch also displays utilization information based on a per day basis, with a maximum of two historical statistic entries supported.
To view this window, click Monitoring > Historical Counter & Utilization > Browse Historical Utilization as shown below:
Figure 7 - 48 Browse Historical Utilization window
The following parameters may be configured:
Parameter Description
CPU/Memory Specify CPU or Memory to display the historical utilization information.
15 Minutes/1 Day Choose whether to view information relating to 15 minute intervals or 1 day intervals.
| 15 Minutes – Specifies historical utilization information based on 15 minute intervals. |
| 1 Day – Specifies historical utilization information based on one day intervals. |
|
|
Slot | Specifies the slot number to display. |
| |
| the most recent. |
| |
| most recent. |
Enter the appropriate information and click Find the information will be displayed in the CPU Utilization table.
System Log
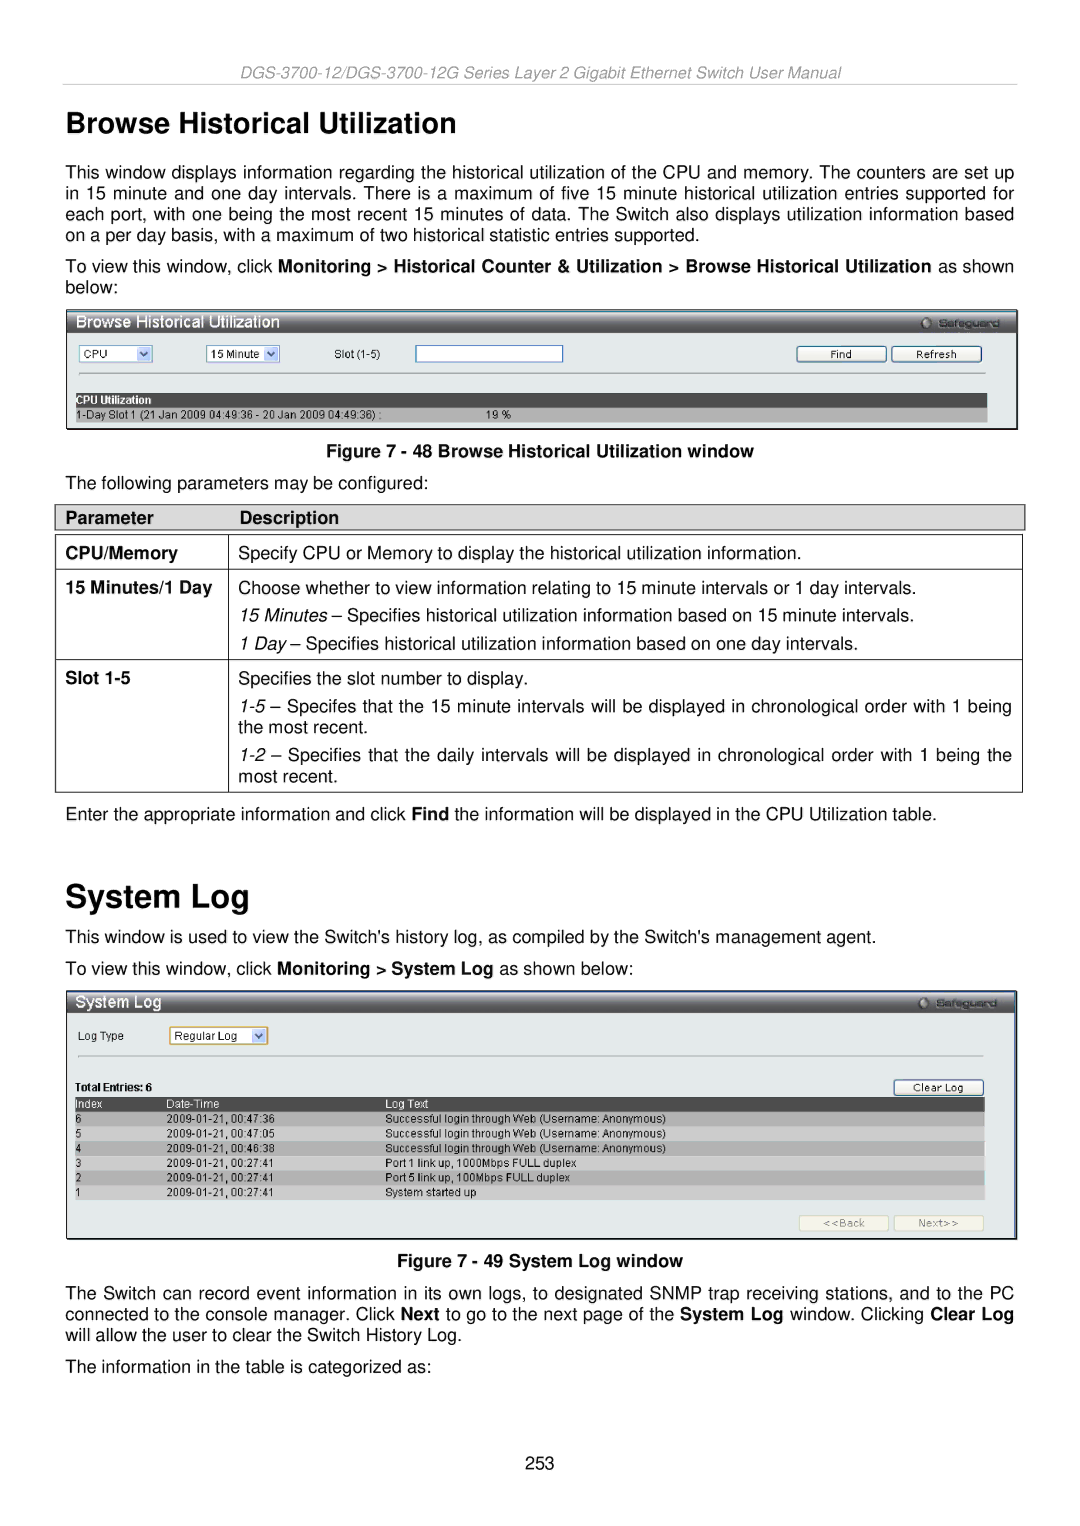
This window is used to view the Switch's history log, as compiled by the Switch's management agent. To view this window, click Monitoring > System Log as shown below:
Figure 7 - 49 System Log window
The Switch can record event information in its own logs, to designated SNMP trap receiving stations, and to the PC connected to the console manager. Click Next to go to the next page of the System Log window. Clicking Clear Log will allow the user to clear the Switch History Log.
The information in the table is categorized as:
253