Section 7
Monitoring
Device Status
Cable Diagnostic
CPU Utilization
Port Utilization
Packet Size
Memory Utilization
Packets
Errors
Port Access Control
Browse ARP Table
VLAN
IGMP Snooping
MLD Snooping
Browse Session Table
CFM
MAC Address Table
Browse VLAN Counter Statistics
Ethernet OAM
Historical Counter & Utilization
System Log
Device Status
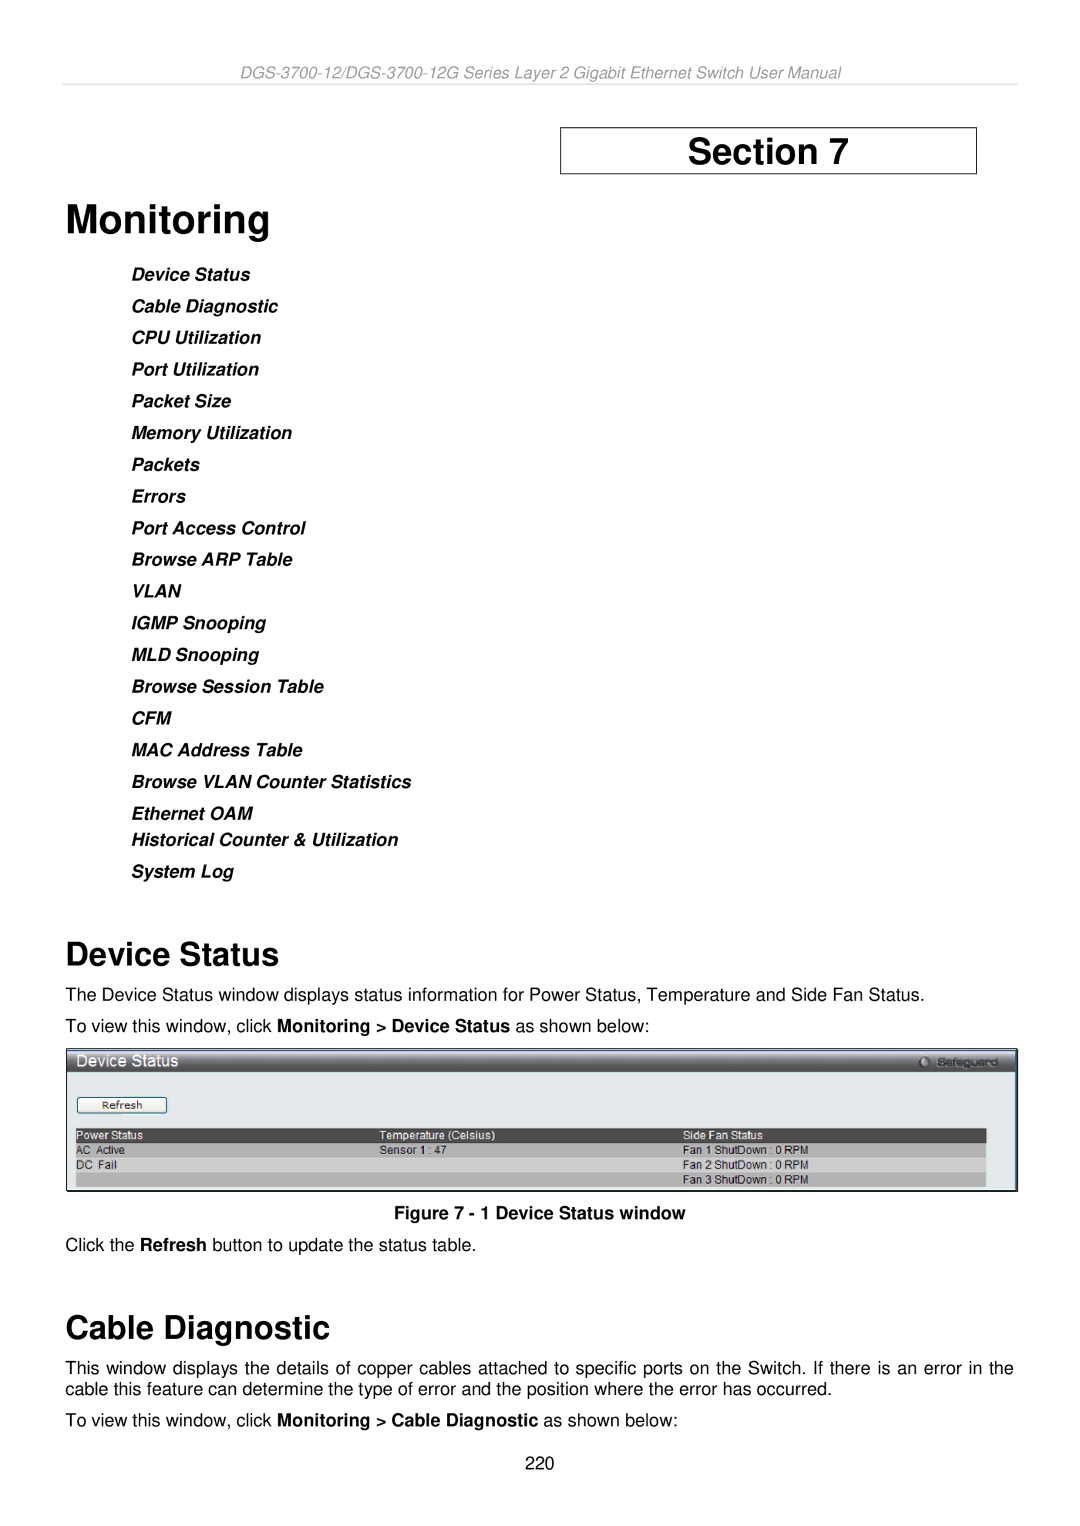
The Device Status window displays status information for Power Status, Temperature and Side Fan Status. To view this window, click Monitoring > Device Status as shown below:
Figure 7 - 1 Device Status window
Click the Refresh button to update the status table.
Cable Diagnostic
This window displays the details of copper cables attached to specific ports on the Switch. If there is an error in the cable this feature can determine the type of error and the position where the error has occurred.
To view this window, click Monitoring > Cable Diagnostic as shown below:
220