Operating manual
13.2.1 Interface description
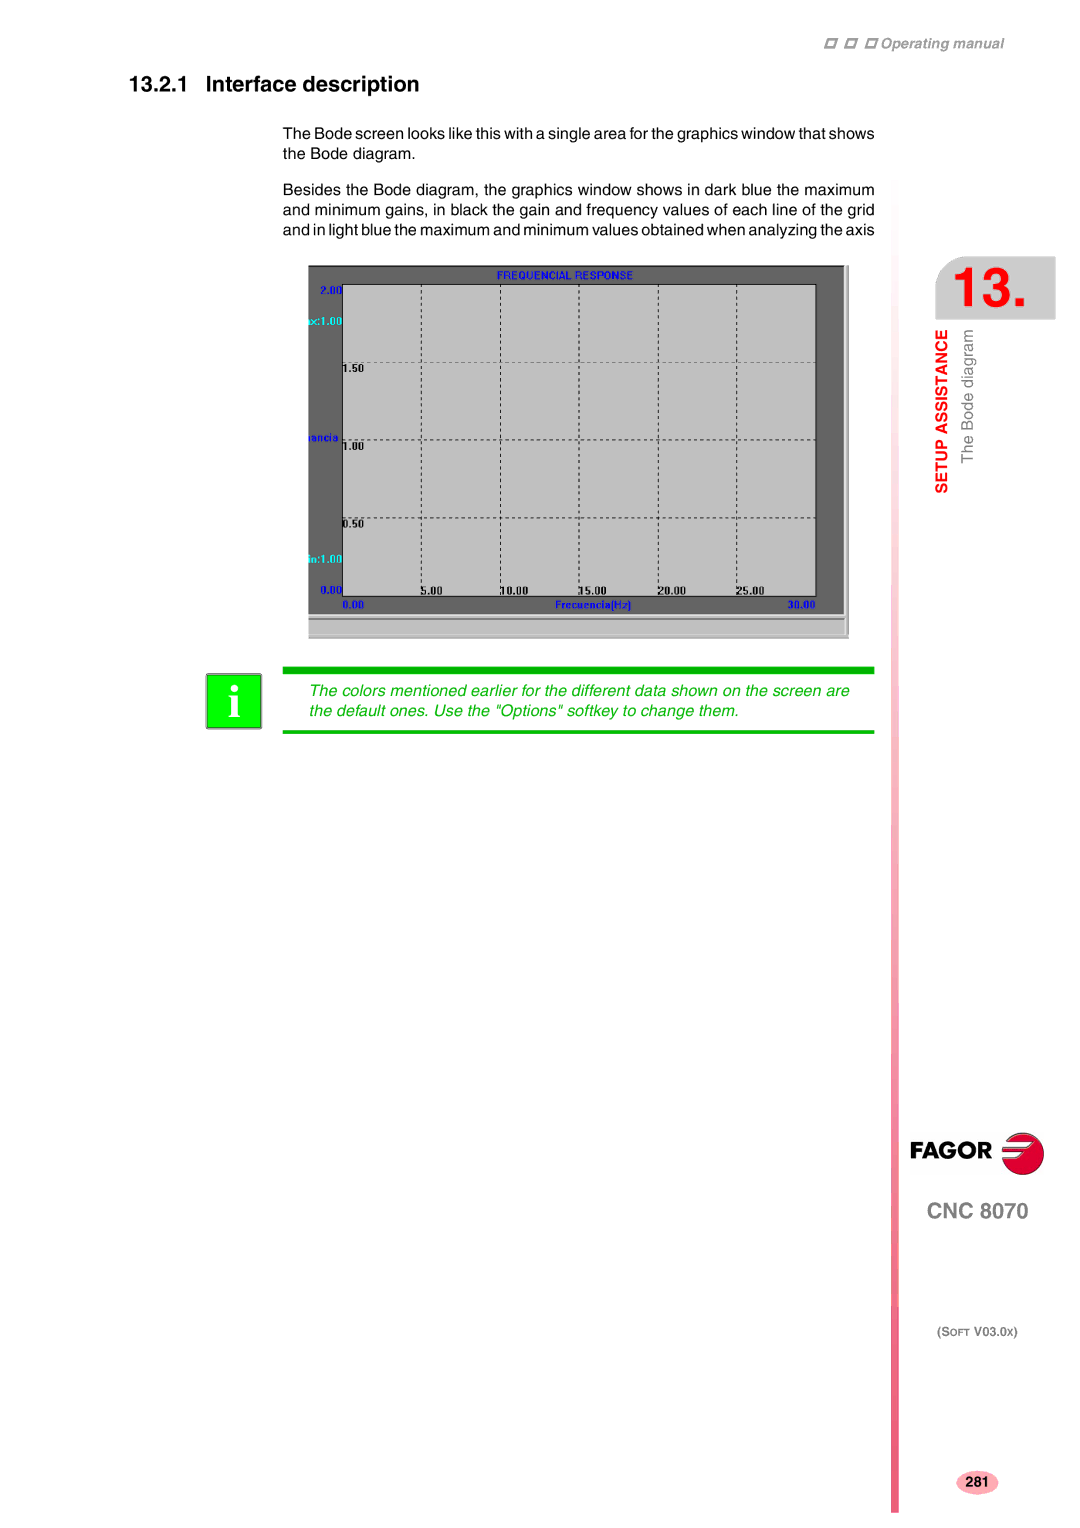
The Bode screen looks like this with a single area for the graphics window that shows the Bode diagram.
Besides the Bode diagram, the graphics window shows in dark blue the maximum and minimum gains, in black the gain and frequency values of each line of the grid and in light blue the maximum and minimum values obtained when analyzing the axis
13.
ASSISTANCE | Bode diagram |
SETUP | The |
i | The colors mentioned earlier for the different data shown on the screen are |
the default ones. Use the "Options" softkey to change them. |
CNC 8070
(SOFT V03.0X)
281
