Operating manual
13.3.1Interface description
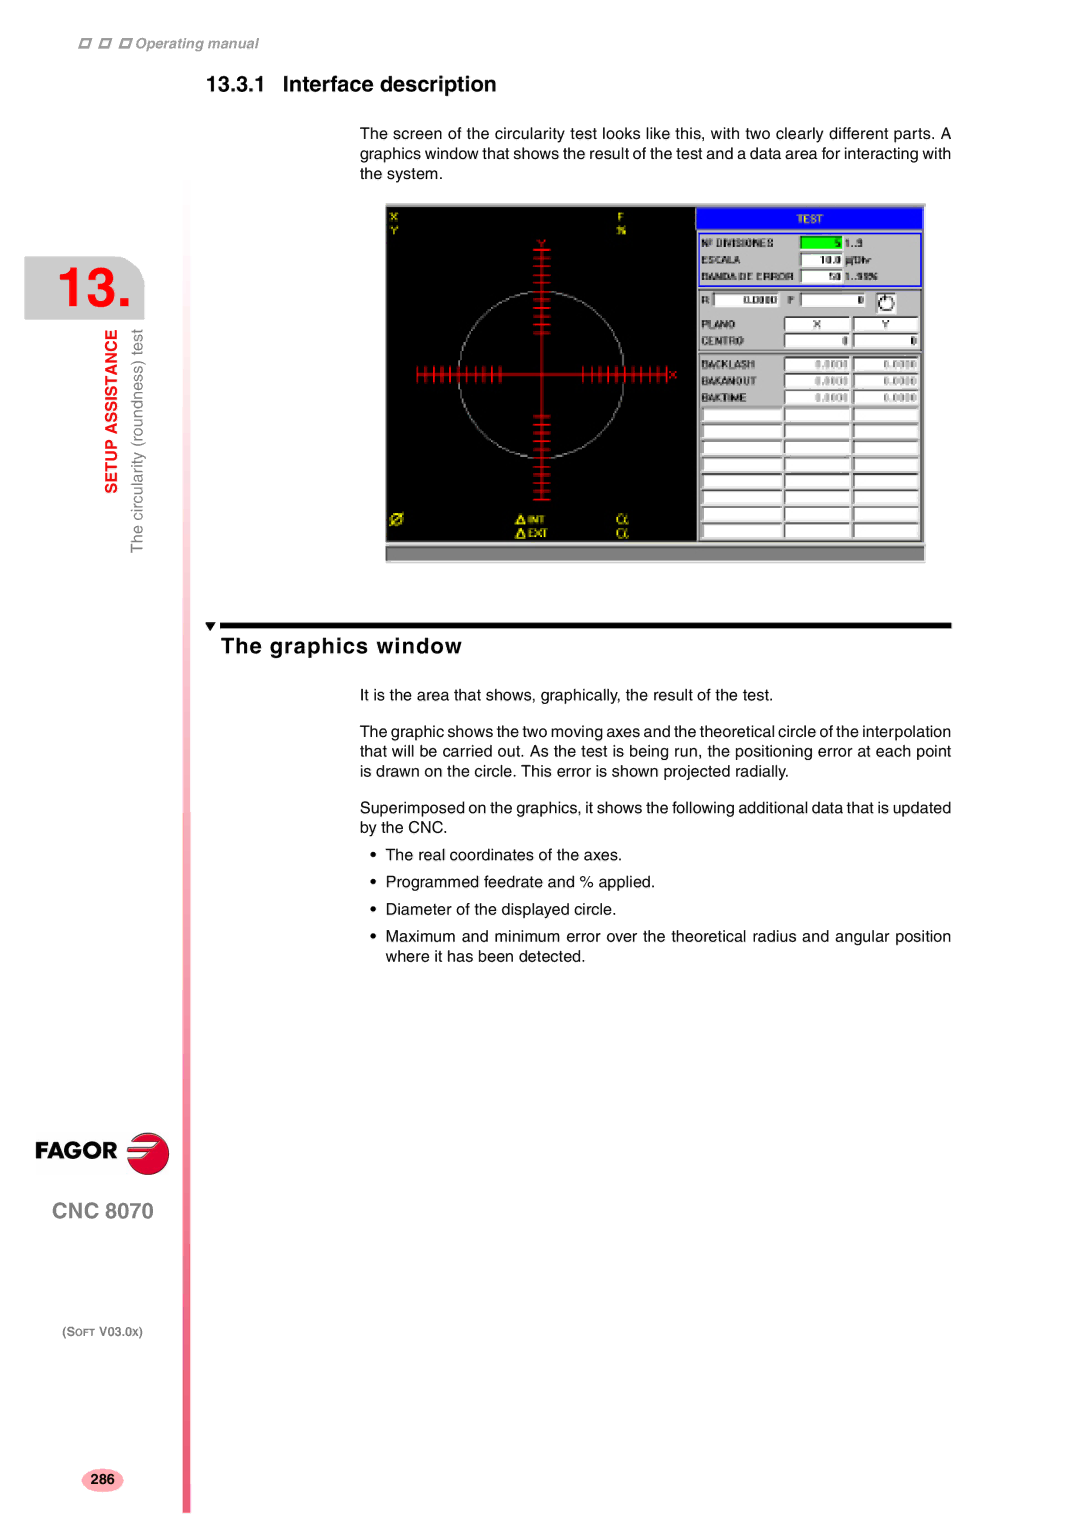
The screen of the circularity test looks like this, with two clearly different parts. A graphics window that shows the result of the test and a data area for interacting with the system.
13.
SETUP ASSISTANCE | circularity (roundness) test |
| The |
The graphics window
It is the area that shows, graphically, the result of the test.
The graphic shows the two moving axes and the theoretical circle of the interpolation that will be carried out. As the test is being run, the positioning error at each point is drawn on the circle. This error is shown projected radially.
Superimposed on the graphics, it shows the following additional data that is updated by the CNC.
•The real coordinates of the axes.
•Programmed feedrate and % applied.
•Diameter of the displayed circle.
•Maximum and minimum error over the theoretical radius and angular position where it has been detected.
CNC 8070
(SOFT V03.0X)
286