Operating manual
13.1.1Interface description
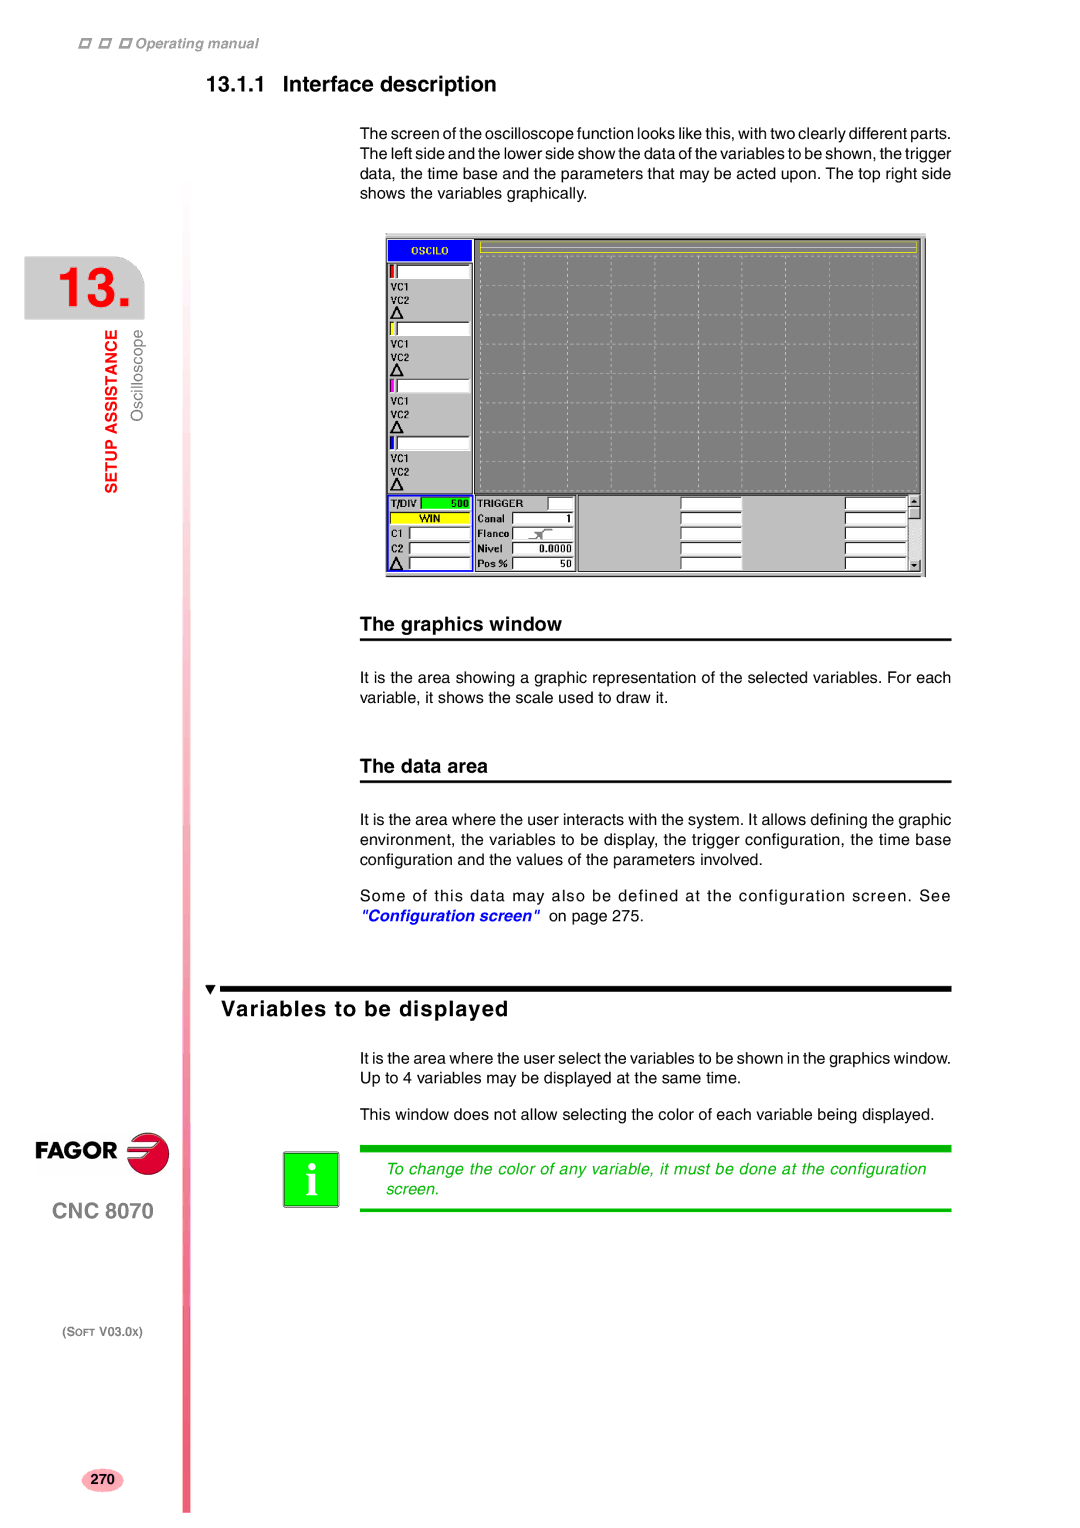
The screen of the oscilloscope function looks like this, with two clearly different parts. The left side and the lower side show the data of the variables to be shown, the trigger data, the time base and the parameters that may be acted upon. The top right side shows the variables graphically.
13.
ASSISTANCE | Oscilloscope |
SETUP |
|
The graphics window
It is the area showing a graphic representation of the selected variables. For each variable, it shows the scale used to draw it.
The data area
It is the area where the user interacts with the system. It allows defining the graphic environment, the variables to be display, the trigger configuration, the time base configuration and the values of the parameters involved.
Some of this data may also be defined at the configuration screen. See "Configuration screen" on page 275.
Variables to be displayed
![]() i
i
CNC 8070
It is the area where the user select the variables to be shown in the graphics window. Up to 4 variables may be displayed at the same time.
This window does not allow selecting the color of each variable being displayed.
To change the color of any variable, it must be done at the configuration screen.
(SOFT V03.0X)
270