SmartWare Release
Patton Electronics Company, Inc
Summary Table of Contents
SmartWare Software Configuration Guide
Table of Contents
Command line interface CLI
Copying configurations to and from a remote storage location
IP context overview
11 NAT/NAPT configuration
Serial port configuration
PRI port configuration
Isdn Overview
Basic IP routing configuration
Snmp configuration
Dhcp configuration
CS context overview
VPN configuration
CS interface configuration
FXO interface configuration
SIP interface configuration
Table of Contents
524
45 H.323 gateway configuration
Pstn profile configuration
Location Service
Terms and definitions
List of Figures
SmartWare Software Configuration Guide
List of Tables
Audience
How to read this guide
About this guide
Structure
About this guide
About this guide
Typographical conventions used in this document
Precautions
General conventions
Garamond bold type
SmartWare Software Configuration GuideAbout this guide
Mouse conventions
Service and support
Patton support headquarters in the USA
Fax +1 253
Patton Electronics Company
Warranty coverage
RMA numbers
System overview
Chapter contents
Introduction
SmartWare embedded software
Circuit Switch
VoIP Gateway
IP Router
Carrier networks
Applications
WAN
Enterprise networks
Typical LAN telephony system with a SmartNode gateway
LAN telephony
Configuration concepts
Configuration concept overview
Context
Contexts and Gateways
Example
Gateway
Interfaces
Interfaces, Ports, and Bindings
Ports and circuits
Bindings
Profiles
Profiles and Use commands
Use Commands
Command line interface CLI
Operator exec mode, the system prompt is displayed as
Command modes
CLI prompt
Command help
Command editing
Command completion
Navigating the CLI
Command Editing Shortcuts
Command history
Accessing the CLI
If desired
Accessing the SmartWare CLI task list
Ending a Telnet or console port session see
Accessing via the console port
Console port procedure
Telnet Procedure
Accessing via a Telnet session
Using an alternate TCP listening port for the Telnet server
Disabling the Telnet server
Login display
Selecting a secure password
Factory preset administrator account
Password encryption
Configuring operators and administrators
Creating an operator account
Name and password password
Creating an administrator account
Opening a secure configuration session over SSH
Nodecfg#copy running-config startup-config
Displaying account information
Mode Enable
Displaying the CLI version
Checking identity and connected users
Switching to another account
Node# who
Node who
Command index numbers
Used in operator execution mode
Accessing the CLI
Ending a Telnet or console port session
Showing command default values
System image handling
System image handling
Memory regions in SmartWare
Local Persistent Volatile Flash
System image handling task list
Show version
Displaying system image information
Copying system images from a network server to Flash memory
Step Command Purpose
Upgrading the software directly
Here’s an example for configuration provisioning
Auto provisioning of firmware and configuration
Explanation
To use and debug provisioning
Boot procedure
Boot procedure
IP Addresses in the Factory Configuration
Default Startup Configuration
Factory configuration
Configuration file handling
Understanding configuration files
Configuration file handling
Sample configuration file
Configuration file handling task list
Local Memory Regions
Copying configurations within the local memory
Backup already present in flash memory
Node# copy nvram backup startup-config
Name nvramtarget-name
Name into the local memory
Remote memory regions for SmartWare
Copying configurations to and from a remote storage location
New-startupnvramstartup-config
Displaying configuration file information
Nodecfg# copy tftp//ip-addressport
Modifying the running configuration at the CLI
Node#reload
Modifying the running configuration offline
Node#copy running-config tftp//node-ip
Deleting a specified configuration
Example Modifying the running configuration offline
Example Deleting a specified configuration
Delete the configuration named minimal explicitly
Encrypted file download
CLI copy command copy tftp//host/path config-file
Encrypted Configuration Download
Auto provisioning
Use Cases
Install a custom encryption key optional
Upload an encrypted configuration file
Encrypt a configuration file
Download an encrypted configuration file
Basic system management
Basic system management configuration task list
Downloads the license key file and install
Managing feature license keys
Node cfg#copy tftp//tftp-server/path/file
Name licenses Licenses
Setting system information
System banner with message to operators
Setting the system banner
Display clock information
Setting time and date
Configuring the Web server
Display time since last restart
Determining and defining the active CLI version
De en
Displaying the system logs
Restarting the system
Unit
Controlling command execution
Displaying reports
Show the currently running commands
Ctrl-zsuspend active command
Ctrl-cterminate current command
Bring job 0 to foreground
Mode System
Timed execution of CLI command
Some examples
Displaying the checksum of a configuration
Name sys#no terminal idle-time
Radius Client Configuration
AAA component
General AAA Configuration
Authentication procedure with a Radius server
Nodepf-authname#server-timeout
Nodecfg#profile authentication name
Authentication profile-name
Nodecfg#show profile authentication
Radius configuration
Example Configure the Radius clients as shown in figure
Configuring Radius clients
Vendor
Configuring Radius accounting
109
Attributes in the Radius request message
Configuring the Radius server
Attributes in the Radius accept message
Configuring the local database accounts
Word password
Example Create an administrator and an operator account
Password
Base. The no form removes an existing account
Storing call logs with quality information
IP context overview
IP context and related elements
IP context overview configuration task list
Configuring physical ports
Planning your IP configuration
Creating and configuring IP interfaces
IP interface related information
Configuring RIP
Configuring Napt
Configuring static IP routing
Configuring quality of service QoS
Configuring access control lists
IP interface configuration
Creating an IP interface
IP interface configuration task list
Nodectx-iprouter#interface name
Nodeif-ip name#
Deleting an IP interface
Configuring a Napt DMZ interface
Setting the IP address and netmask
Name if-ip if-name# no napt
Inside
Router advertisement broadcast message
Icmp message processing
Icmp redirect messages
Defining the MTU and MSS of the interface
Nodeif-ipname#tcp adjust-mss
Example Defining the MTU of the interface
MTU packet size value must be in the range from
Displaying IP interface information
Configuring an interface as a point-to-point link
Displaying dynamic ARP entries
Testing connections with the ping command
Flushing dynamic ARP entries
Processing gratuitous ARP requests
Ber timeout seconds
Mode Either operator or administrator execution
IP link supervision
Node#ping address num
Show IP link status
Check connectivity of an IP link
Debug connectivity
Debug ARP
Example Debug ARP output
Traceroute
Example Display the ARP information
Configuring the Igmp Proxy
NAT/NAPT configuration
Dynamic Napt
Dynamic NAT
Tftp because the SmartNode might become inaccessible
Static Napt
Napt traversal
Static NAT
Creating a Napt profile
NAT/NAPT configuration task list
Node cfg#profile napt name
Optional
Defining Napt port ranges
Configuring a Napt DMZ host
Optional Ahespgreipv6 localip
AH, ESP, GRE, or IPv6 respectively directed to
Name pf-napt pf-name# udp-handling symmetricaddress
Preserving TCP/UDP port numbers in Napt
Defining the UDP Napt type
Displaying NAT/NAPT configuration information
Activate NAT/NAPT
Node cfg#context ip router
Node cfg#show profile napt
Configuring NAT static protocol entries
Mode profile napt pf-napt
Example Display NAT/NAPT configuration information
Ethernet port configuration
Configuring medium for an Ethernet port
Entering the Ethernet port configuration mode
Ethernet port configuration task list
Binding an Ethernet port to an IP interface
Configuring Ethernet encapsulation type for an Ethernet port
Nodeprt-eth slot/port#encapsulation ip
Configures the encapsulation type to IP
Nodeprt-eth slot/port#bind interface name router
Multiple IP addresses on Ethernet ports
Configuring a Vlan
Nodeprt-ethslot/port#vlan id
Nodeconfig#port ethernet slot port
Nodevlanid#encapsulation ippppoemulti
Nodevlanid#bind interface name router
Nodeprt-eth slot/port#cos rx-map layer
Adding a receive mapping table entry
Example Adding a receive mapping table entry
Closing an Ethernet port
Adding a transmit mapping table entry
Using the built-in Ethernet sniffer
Nvramethernet-0-0-1.cap
Following is an example of how the sniffer is normally used
Nvramethernet-0-slot-port.cap
Link scheduler configuration
Applying scheduling at the bottleneck
Using traffic classes
Introduction to Scheduling
Weighted fair queuing WFQ
Priority
Shaping
Hierarchy
Burst tolerant shaping or wfq
Quick references
Setting the modem rate
Policy-map policy-map Profile service-policy
Command cross reference
Link scheduler configuration task list
Source traffic-class class
Packet classification
Enable statistics gathering see
Defining the access control list profile
Scenario with Web server regarded as a single source host
Creating an access control list
Nodecfg#profile acl name
Creating a service policy profile
Nodepf-acl name#permit ip host ip-address any traffic-class
Nodepf-acl name#permit ip any any
Structure of a Service-Policy Profile
Specifying the handling of traffic-classes
Defining fair queuing weight
Specifying the type-of-service TOS field
Mode Source
Defining the bit-rate
Defining absolute priority
Specifying the precedence field
Specifying differentiated services codepoint Dscp marking
Nodesrc name#set ip tos value
Nodesrc name#set ip precedence value
Specifying layer 2 marking
Defines the Class-Of-Service value applied to packets of for
Nodesrc name#set ip dscp value
Value is from 0 to
Defining random early detection
Quality of Service for routed RTP streams
Discarding Excess Load
Nodesrc name#random-detect burst-tolerance
Mode profile service-policy/profile
Policy name in out
Devoting the service policy profile to an interface
Nodeif-ip if-name#use profile service
Displaying link scheduling profile information
Enable statistics gathering
Displaying link arbitration status
Optional Value Implication on Command Output
Serial port configuration
Disabling an interface
Serial port configuration task list
Enabling an interface
Port
Configuring the serial encapsulation type
Configuring the hardware port protocol
Configuring the active clock edge
Baudrate
Configuring the baudrate
176
Frame Relay configuration
Configuring Frame Relay encapsulation
Frame Relay configuration task list
Configuring the keep-alive interval
Configuring the LMI type
Ber to be used on the specified virtual circuit
Enabling fragmentation
Nodepvc dlci#fragment size
For this PVC only FRF.12 end-to-end fragmentation
Entering Frame Relay PVC configuration mode
Binding the Frame Relay PVC to IP interface
Configuring the PVC encapsulation type
IP interface wan is bound to PVC 1 on port serial 0
Mode PVC
Disabling a Frame Relay PVC
Enabling a Frame Relay PVC
Debugging Frame Relay
Displaying Frame Relay information
Integrated service access
188
Check that the Frame Relay settings are correct
Configure the serial interface settings
Example 2 Frame Relay on e1t1 with a channel-group
PRI port configuration
PRI port configuration task list
Terminology
PRI Debugging
Enable/Disable PRI port
Configuring PRI port-type
Configuring PRI clock-mode
Name prt-e1t1 slot/port# linecode
Configuring PRI framing
Ami b8zs hdb3
Name prt-e1t1 slot/port# framing
Configuring PRI application mode E1T1 only
Configuring PRI line-build-out E1T1 in T1 mode only
Configuring PRI used-connector E1T1 in E1 mode only
Configuring PRI Loopback detection E1T1 only
Configuring PRI LOS threshold E1T1 only
Configuring PRI encapsulation
Default disabled
Create a Channel-Group
Mode channel-group group-name
Configuring Channel-Group Timeslots
Configuring Channel-Group Encapsulation
Mode channel-group group
Entering Hdlc Configuration Mode
Mode hdlc
Configuring Hdlc CRC-Type
PRI Debugging
Default no encapsulation
Configuring Hdlc Encapsulation
PRI Configuration Examples
Example 3 RBS with a channel-group
Example 1 Isdn
Example 2 RBS without a channel-group
Example 4 Frame Relay without a channel-group
Example 7 PPP with a channel-group
Example 5 Framerelay with a channel-group
Example 6 PPP without a channel-group
BRI port configuration
Configuring BRI clock-mode
Enable/Disable BRI port
BRI port configuration task list
Feed Default disabled
Configuring BRI Power-Feed
Configuring BRI encapsulation
Creating a channel group
Timeslots timeslots
Default no timeslots
Name ch-grp group-name#no Selects the timeslot to be used
Name#show port bri
BRI Debugging
Name#no debug bri
BRI Configuration Examples
Example 1 Isdn with auto clock/uni-side settings
Example 2 Isdn with manual clock/uni-side settings
Example 3 Multi-Link PPP over two B-Channels
Isdn Overview
Isdn reference points
Isdn reference points
Possible SmartNode port configurations
Isdn UNI Signaling
215
Isdn Layering
Isdn Configuration Concept
Isdn configuration
Mode base-mode
Enter Q.921 configuration mode
Isdn configuration task list
Configuring Q.921 parameters
Configuring Q.921 encapsulation
Mode q921
Enter Q.931 configuration mode
Configuring Q.931 parameters
Mode q931
Nodeq931slot/port#no signalling-rule
Nodeq931slot/port#signalling-rule
Etsi
Pss1old
Debugging Isdn
Configuring Q.931 encapsulation
Face if-name
Control interface
Node#show port isdn slot port detail level
Isdn Configuration Examples
Example being clock slave on uni network interface
Example PRI
Example Qsig
Assume the scenario as illustrated in figure
RBS configuration
Configuring RBS protocol
Enter RBS configuration mode
RBS configuration task list
Configuring RBS encapsulation
Mode rbs
Debugging RBS
Noderbs#no encapsulation cc-rbs
Example Configuring RBS Ground Start on a E1T1 port
RBS Configuration Examples
229
DSL Port Configuration
Configuring PPPoE
Line Setup
Profile napt WAN
Configuration Summary
Using PVC channels with PPPoE
Setting up permanent virtual circuits PVC
Using PVC channels in bridged Ethernet mode
Diagnostics
Troubleshooting DSL Connections
PPPoE access
Link State
Basic IP routing configuration
Routing tables
Basic IP routing configuration task list
Static routing
Policy routing
Configuring static IP routes
Displaying IP route information see
Nodecfg#context ip router Enters the IP router Context
Adds a static route
Displaying IP route information
Deleting static IP routes
0.0/0 172.16.32.2 Static
Configuring policy routing
Basic static IP routing example
Examples
Changing the default UDP port range for RTP and Rtcp
RIP configuration
Routing protocol
Enabling send RIP
RIP configuration task list
Specifying the send RIP version
Enabling an interface to receive RIP
Enabling RIP learning
Example Enabling RIP learn host and default
Specifying the receive RIP version
Enabling RIP announcing
Enabling RIP auto summarization
Specifying the default route metric
Enabling the poison reverse algorithm
Enabling RIP split-horizon processing
3600 Default 180 seconds
Setting the RIP route expiry
Enabling holding down aged routes
Nodeif-ipname#rip route-expiry
Displaying global RIP information
Displaying RIP configuration of an IP interface
252
Access control list configuration
Why you should configure access lists
About access control lists
What access lists do
Features of access control lists
When to configure access lists
Mapping out the goals of the access control list
Access control list configuration task list
Nodepf-acl name#permit ip src src-wildcard any
Where the syntax is
Type type type type code code cos group
Nodepf-acl name#permit icmp src src-wildcard any
Nodepf-acl name#deny icmp src src-wildcard
Any host src dest dest-wildcard any host dest
Msg name
Where the syntax is as following
Type type
Code code
Card any host src eq port gt port lt port range
Nodepf-acl name#permit tcp udp sctp src src-wild
Port lt port range from to cos group cos-rtp group
Nodepf-acl name#deny tcp udp sctp src src
Lt port
Eq port
Gt port
Range from to
Where the syntax is
Debugging an access control list profile
Unbind an access control list profile from an interface
Displaying an access control list profile
Control list profile shall be debugged
Denying a specific subnet
Commands that have to be entered are listed below
Snmp configuration
Snmp basic components
Snmp basic commands
Simple Network Management Protocol Snmp
Network management framework
Identification of a SmartNode via Snmp
Snmp management information base MIB
Snmp configuration task list
Setting basic system information
Snmp tools
271
Example Setting the system group objects
Setting access community information
Ro rw Or read/write access
Specifying the default Snmp trap target
Setting allowed host information
Nodecfg#snmp host IP-address-of-SN security
Nodecfg#snmp target IP-address-of-SN
Displaying Snmp related information
Using the AdventNet Snmp utilities
AdventNet MibBrowser Settings Button on the Toolbar
Using the MibBrowser
AdventNet TrapViewer displaying received traps
Using the TrapViewer
Enterprise
TimeStamp
Generic Type
Specific Type
Standard Snmp version 1 traps
Snmp interface traps
281
Sntp client configuration
Sntp client configuration task list
Unicast anycast multicast
Defining Sntp client operating mode
Selecting Sntp time servers
Defining Sntp local UDP port
Example Enabling the Sntp client operation
Enabling and disabling the Sntp client
Example Disabling the Sntp client operation
Defining Sntp client poll interval
Defining the Sntp client anycast address
Defining Sntp client constant offset to GMT
Name #show clock local
Displays the local time, UTC and the offset of the local
Nodecfg#sntp-client anycast-address ip
Example Enabling the Sntp client root delay compensation
Enabling and disabling local clock offset compensation
Showing Sntp client related information
Example Disabling the Sntp client root delay compensation
Example Showing Sntp client related information
Debugging Sntp client operation
Recommended public Sntp time servers
Nist Internet time service
291
Dhcp configuration
Dhcp configuration
DHCP-server and DHCP-client are illustrated in figure
Enable DHCP-client on an IP interface
DHCP-client configuration tasks
‘configure’ configuration mode
Example Enable DHCP-client on an IP interface
Example Enable Dhcp debug monitor
Mode Any
Release or renew a Dhcp lease manually advanced
Get debug output from DHCP-client
Configure DHCP-server profiles
DHCP-server configuration tasks
Nodepf-dhcpsname#no netbios
Nodepf-dhcpsname#no default
Nodecfg#profile dhcp-server name
Nodepf-dhcpsname#network ip
Nodepf-dhcpsname#no bootfile boot
Use DHCP-server profiles and enable the DHCP-server
Nodepf-dhcpsname#no next-server
All ip-address
Check DHCP-server configuration and status
Define the bootfile Option 67 for the DHCP-server
Define the Tftp server Option 66 for the DHCP-server
Get debug output from the DHCP-server
Create/Modify DHCP-Relay profile
Configure DHCP-relay
Enable/Disable DHCP-Relay Agent
DNS configuration
Server-ip-address
DNS configuration task list
Enabling the DNS resolver
Enabling the DNS relay
DNS relay diagram
307
DynDNS configuration
Creating a DynDNS account Configuring the DNS resolver
DynDNS configuration task list
Word
Configuring basic DynDNS settings
Configuring the DynDNS server
Mode DynDNS
Configuring advanced DynDNS settings optional
Troubleshooting
Defining a mail exchanger for your hostname
312
PPP configuration
314
Nodeif-ipname#point-to-point
PPP configuration task list
Creating an IP interface for PPP
Nodeif-ipname#ipaddress
Nodeif-ipname# no tcp adjust-mss
Nodeif-ipname#ipaddress dhcp
Nodeif-ipname# ipaddress ip-address
Creating a PPP subscriber
Disable interface IP address auto-configuration from PPP
Nodeif-ipname#use profile napt name
Nodecfg # subscriber ppp name
Nodesubscrname# dial inout
Optional outboundinbound user password
Chap pap chappap
Nodesubscrname# no identification
Configuring a PPPoE session
Trigger forced reconnect of PPP sessions using a timer
Tor AC-Name
Configuring PPP over a Hdlc Link
Case authentication is required
Creating a PPP profile
Optional file
Nodecfg #no profile ppp name
Default
Nodepf-pppname#mtu min min max
Nodepf-pppname#mru min min max
Default
Min max max default
Configuring the local and remote PPP Mrru
Name pf-ppp profile# mrru min
Example Display PPP subscriber configuration information
Displaying PPP configuration information
Debugging PPP
Example Display a PPP profile
Nodecfg #show ppp networks level
Nodecfg #show ppp links level
Nodecfg #show pppoe name
Nodecfg #show port interface name
LCP
Example Display PPP link information
Example Display PPPoE information
Example Display PPP network protocol information
With authentication, encapsulation PPPoE
Without authentication, encapsulation multi, with Napt
Sample configurations
PPP over Ethernet PPPoE
With authentication, unnumbered interface
Without authentication, numbered interface
PPP over a Hdlc Link Serial Port
PPP over a Hdlc Link E1T1 Port
PPP Dialer
PPP Dial-up over Isdn
Dial-up and login information for a certain
Following command creates a new PPP dialer Mode context cs
Create a dialer
Create outbound destinations
Configure recovery strategy
Case
Create inbound destinations
Name inboundprovider#local-e164
Name if-dialerdialer#inbound
E164
Name inboundprovider#remote-e164
Debug dialer functionality
Example Dial-on demand feature
Dial-up on demand
Dial-up
Dial-up nailed
Dial if possible, and never drop Mode context ip/interface
Dial-up on monitor
CS context overview
CS context configuration components
Planning the CS configuration
CS context configuration task list
Remote office in an Enterprise network
Configuring the clock source
Configuring general CS settings
Debugging the clock source
Mode Operator execution
Selecting PCM law compression
Configuring call routing
Node sys#clock-sourceslot-number port-number
Reference clock
Specify call routing
Creating and configuring CS interfaces
Configuring voice over IP parameters
Configuring dial tones
Configuring FXS ports
Configuring Isdn ports
Configuring an H.323 VoIP connection
Configuring a SIP VoIP connection
Activating CS context configuration
Node ctx-csswitch#debug call-router detail level
Nodectx-csswitch#show call-router config detail
Nodectx-csswitch#show call-router status detail
Level
SmartNode in an Enterprise network
CS Configuration
Planning the CS context
Configuring call routing
Configuring general CS settings
First we set clock-source to Isdn port 2/3
354
Because we need G.723 as codec we enable Dtmf relay
Configuring VoIP settings
We want to use this profile on our H.323 interfaces
Configuring BRI ports
Activating the CS context configuration
Next we configure call signaling
Configuring an H.323 VoIP connection
TAB-CALLED-NUMBER
Finally, activate the gateway and CS context
Configuration script for our application looks as follows
Showing the running configuration
359
360
361
VPN configuration
Encryption
Authentication
Key management
Transport and tunnel modes
Permanent IKE Tunnels
Creating an IPsec transformation profile
VPN configuration task list
Example Create an IPsec transformation profile
Creating an IPsec policy profile
Procedure To create an IPsec policy profile Mode Configure
Creating/modifying an outgoing ACL profile for IPsec
Displaying IPsec configuration information
Configuration of an IP interface and the IP router for IPsec
Example Display IPsec policy profiles
Example Display IPsec transformation profiles
Debugging IPsec
Example IPsec Debug Output
Creating an Ipsec transform profile
Key management IKE
Main differences between manual & IKE Ipsec configurations
Creating an Isakmp transform profile
Should be used. Do not specify a peer, if this pol
Creating an Isakmp Ipsec policy profile
Icy shall be used for multiple peers in transport
Mode. The peer can either be an IP address or a
Configuration of an IP interface and the IP router for Ipsec
Creating/modifying an outgoing ACL profile for Ipsec
Policy matching
Sample configuration snippet
Debug ike event
Debug ike error
Use profile acl WANOut out
Performance considerations
Encrypted Voice Performance considerations
Enabling RTP encryption support
Mode Context ip /interface if-name
SmartNode configuration
IPsec tunnel, DES encryption
Cisco router configuration
379
380
CS interface configuration
CS interfaces on the CS context
CS interface configuration task list
Nodeif-typeif-name#exit
Examples Create CS interfaces and delete another
Nodeif-typeif-name#…
384
Table table-name
Service service-name Nodeif- typeif-name #exit
Configuring the interface mapping tables
That shall be applied to all call properties
Table in table-name
And/or
Specified direction
Incoming call passing an interface mapping table
Call passing an input and an output mapping table
Configuring the precall service tables
Number to command
Supplementary service invocation commands
Supplementary service invocation command
Repeat to add other special number map
Isdn interface configuration
Isdn interfaces on the CS context
Isdn interface configuration task list
Configuring an alternate Pstn profile optional
Configuring Dtmf dialing optional
Nodeif-isdn if-name#no use profile
Defines an alternate Pstn profile to be used for
Configuring ringback tone on Isdn user-side interfaces
Name if-isdn if-name# no call-waiting Disable call-waiting
Configuring call waiting optional
Disabling call-waiting on Isdn DSS1 network interfaces
Configuring date/time publishing to terminals optional
Configuring Call-Hold on Isdn interfaces
Enabling Display Information Elements on Isdn Ports
Defining the ‘network-type’ in Isdn interfaces
Sending the connected party number Colp optional
Home Office
Isdn Advice of Charge support
398
All calls
If there is no tariff information from the network for
Nodeif-isdnif- name# aoc-d automatic
If there is not charge information from the network
Following table shows an overview of the AOC variants
Isdn User Interface Connected to a PBX switch etc
Isdn Network Interface connected to phones
NoChargeAvailable
Isdn DivertingLegInformation2 Facility
Mode interface isdn interface
Transmit Direction
Receive Direction
500
Nodeif-isdn#caller-name
Nodeif-isdn#caller-name early-alerting
By default
Outgoing Isdn call. This feature is disabled
Nodeif-isdn#caller-name ignore
Absence
FXS interface configuration
Configuring a subscriber number recommended
FXS interface configuration task list
Configuring caller-ID presentation optional
Mode Interface FXS
Configuring flash hook processing optional
Nameif-fxsname#no subscriber
Configuring ringing-cadence optional
Ing-indication stutter-dial-tone Through Stuttered Dial Tone
Configuring the Message Waiting Indication feature for FXS
Mat bell
Frequency-shift keying
Mat etsi
Call hold Call transfer
FXS supplementary services description
Call hold
Default enabled
Call waiting
Tern
Drop passive call
Call waiting reminder ring
Drop active call
Call toggle
Call park
Conferencing
Nameif-fxsname#no drop-passive
Pattern
FXO interface configuration
FXO interfaces on the CS context
Creating an FXO interface
FXO services description
Nodeif-fxo name #
Nodectx-csswitch#interface fxo name
Deleting an FXO interface
FXO off-hook on caller ID
FXO interface configuration task list
Nodectx-csswitch#interface fxo if-name
Configuring when the digits are dialed optional
Nodeif-fxoif-name#
Nodeif-fxo if-name#
Nodeif-fxoif-name#dial-after dial-tone timeout seconds
Figuration mode
Nodeif-fxo if-name #ring-number count
Nodeif-fxo if-name#
Min min-time max max-time
Configuring how to detect a call has disconnected optional
Battery-reversal tax-pulse
Nodeif-fxo if-name#no connect-signal
FXO Mute dialing
Configuring the destination of the call
FXO interface examples
RBS interface configuration
Creating/Deleting a RBS interface
RBS interface configuration task list
Configuring an alternate Pstn profile
Name Face, the ‘no’ form deletes an existing one
Configuring additional disconnect signals
Mode Interface RBS
Configuring an alternate Tone-Set profile
Configuring B-Channel allocation strategy
Node#no debug ccrbs datapath error signaling
Nodeif-rbsif-name#no dial-after dial- tone timeout seconds
Configuring number of Rings before Off-Hook
Configuring ready to dial strategy
Prints information about ongoing calls on
Node#show ccrbs call if-name detail level
Selected interface
Node#show ccrbs interface if-name detail
Interface configuration
Interface configuration task list
Examples Define the IP address of the remote H.323 entity
Binding the interface to an H.323 gateway
Configuring an alternate VoIP profile optional
Node if- h323 if-name #itc rx 3k1
Configuring CLIP/CLIR support optional
Specifies the information transfer capability to
Node if- h323 if-name #itc tx 3k1
Enabling the early call connect optional
Enabling ‘early-proceeding’ on H.323 interfaces
Nameif-h323if-name#early-proceeding
Nameif-h323name#early-connect
Enabling the via address support optional
Enabling the early call disconnect optional
Ing connection should be established
Configuring status inquiry settings optional
Nodeif-h323if-name# remoteport port
AOC-D Support for H.323
Nodeif-h323if-name# no aoc-d emit
Mode context cs/interfce h.323 interface-name
Nodeif-h323if-name# no aoc-d
SIP interface configuration
SIP interface configuration task list
SIP
Configure a remote host
Binding the interface to a SIP gateway
Nodeif-sipif-name# no bind context
Sip-gateway gw-name
Configuring a local host Optional
Using an alternate VoIP profile Optional
Nodeif-sipif-name# no remote host
Nodeif-sipif-name# no local host
Using an alternate Tone-Set profile Optional
Using an alternate SIP profile Optional
Nodeif-sipif-name#use profile voip
Nodeif-sipif-name#use profile sip pro
Mapping call-control properties in SIP headers
Configuring early call connect / disconnect Optional
Configuring address translation Optional
Header
Mapping SIP headers to call-control properties
Configuring Isdn Redirecting Number Tunneling Over SIP
Updating caller address parameters
SIP Diversion Header
450
SIP Refer Transmission & Isdn Explicit Call Transfer support
452
Name if-sip interface#no aoc-d
AOC Over SIP Optional
Accept
Name if-sip interface#no aoc-d emit
Enabling the SIP penalty-box feature Optional
Enabling the session timer Optional
Configure the SIP hold method Optional
Default zero-ip
Call router configuration
Call router configuration
458
Direct call routing vs. advanced call routing
Map out the goals for the call router
Call router configuration task list
Configure general call router behavior
Enable advanced call routing on circuit interfaces
Configure address completion timeout
Address-completion timeout timeout
Example Configure address completion timeout
Digit-collection timeout timeout
Digit-collection terminating-char char
Configure number prefix for Isdn number types
Procedure To configure number prefix Mode Context CS
Example Configure number prefix
National-prefix prefix
Create a routing table
Configure call routing tables
Calling-e164
Regular Expressions
Example Called party number routing table
Called party number routing table
Symbol Description
Digit Collection
Digit Collection Variants
Example Digit collection of any number
Dialed Selected Description Number Entry
Number type routing table
Calling party number routing table
Numbering plan routing table
IP address routing table
Name routing table
URI routing table
Presentation Indicator Routing Table
Smith must be escaped with a backslash \, because
Dot . means ‘any character’ in a regular expression
Screening Indicator Routing Table
Information transfer capability routing table
478
Time of day routing table
Default Any other unhandled case Mode context cs
Day of Week Routing Table
Example Day of week routing table
Node ctx-cs switch #routing-table
Procedure To delete an entire routing table
Deleting routing tables
Resulting running-config is
Example Remove an entire routing table
Node ctx-cs switch #no routing-table
Configure mapping tables
Delete the routing table table-name
Type Description Input-Type Description Output-Type
Sets the display name of the called
Mapping table examples
To E.164 Mapping Tables
Example Called and calling party manipulation mapping table
Input-type to output-type table-name
Away the input-type and output-type
486
487
Other mapping tables
Custom SIP URIs from called-/calling-e164 properties
Enter the mapping table from which you want to remove an
Node ctx-cs switch #mapping-table
Deleting mapping tables
Creating complex functions
Procedure To delete an entire mapping table Mode Context CS
Example Remove an entire mapping table
Deleting complex functions
Example Create a complex function
Digit collection & sending-complete behavior
Example Remove an entire complex function
Sending-Complete
Ingress interface
323
Call-Router
123#
Yes
True
Egress Interface
Complete-indication clear
Mode context cs / interface sip
Creating a hunt group service
Creating call services
Hunt group service
Call dest-service service-name
Node ctx-cs switch #service hunt
Cause cause
Call dest-interface interface-name
Normal Event
Default Behavior Class Cause Hunt Description Group Service
No-user-responding Drop original call
Resource
Service or
Unavailable
Option Not
Invalid Message
Implemented
Protocol Error
Interworking
Distribution group service
Creating a distribution group service
Nodesvc-huntservice-name# route call
Node ctx-cs switch #service distribu
Dest-service service-name
With the first configured destinations
Call-router ‘limiter’ service
Distribution-Group Min-Concurrent setting
‘Limiter’ service diagram
Priority service
Priority service diagram
Bridge
CS Bridge service-‘VoIP Leased Line’
Bridge services diagram
Configuration Example
Configuring the service second-dialtone
Activate the call router configuration
Deleting call services
Example Create and test a routing table
Test the call router configuration
516
Call routing example network
518
CS context and call router elements
520
Configure partial rerouting
Enable push-back aaa service
Mode context cs/interface sip
Mode context cs/service aaa
Call reroute
Enable push-back distribution-group service
Enable push-back bridge service
Enable push-back hunt group service
Enable push-back limiter service
SIP call-router services
SIP conference-service configuration task list
SIP conference-service
Entering conference-service configuration mode
Name ctx-csswitch#no service sip
Mode Service SIP conference
SIP location-service
Configuring the conference server
Ference-server host-name port
Entering SIP location-service configuration mode
SIP location-service configuration task list
Configuring the hunt timeout
Binding a location service
Configuring multi-contact behavior
Seconds
Tone configuration
Tone-set profiles
Configuring call-progress-tone profiles
Tone configuration task list
Configure tone-set profiles
Procedure To configure a tone-set profile Mode Configure
For which a tone indication can be provided
Enable tone-set profile
Procedure To assign a tone-set profile to a Pstn interface
Example Show tone-set profile
Show call-progress-tone and tone-set profiles
Node#show profile call-progress-tone
Name Cific with name name
Following example shows how to display the tone-set profile
536
FXS port configuration
Shutdown and enable FXS ports
Netherlands
Bind FXS ports to higher layer applications
Configure country-specific FXS port parameters
Enter FXS port configuration mode
Mode IC voice in system
Other FXS port parameters
Nodeconfig#port fxs slot port
Example
FXO port configuration
Bind FXO ports to higher layer applications
Shutdown and enable FXO ports
Other FXO port parameters
Configure country specific FXO port parameters
Nodeconfig#port fxo slot port
Nodeprt-fxo slot/ port#use
Enter FXO port configuration mode
Gateway configuration
Gateway between IP and CS contexts
Enable the gateway
Mode Gateway H.323
Gateway configuration task list
Binding the gateway to an IP interface
Configure registration authentication service RAS Optional
Ery auto gkid
Configure H.235 Security optional
Node gw-h323h323#gatekeeper-discov
235 configuration
Procedure To enable H.235 security on H.323 gateway
Word h235-password encrypted
\getcryptopassword h235-password mas
Node gw-h323h323#h235security master
Node gw-h323h323#h235security pass
Command show h235-securityshows the current setting
Default setting is
Signaling message
Detail debug-level
Enabling H.245 Tunneling
Advanced configuration options optional
Enabling the early H.245 procedure
Enabling the fastconnect procedure
Nodegw-h323h323#h245-tunneling Enables H.245 tunneling
Nodegw-h323h323#faststart Enables the fastconnect procedure
Setting the response timeout
Configuring the traffic class for H.323 signaling
Nodegw-h323h323#call-signaling-port
Port Naling connections
Istration
Setting the connect timeout
Nal gateway
Nodecfg#debug gateway h323 signaling
Nodecfg#debug gateway h323 error
H323 status detail level
Nodecfg#debug gateway h323 tpktchan
Context SIP gateway overview
Routing Architecture
Context SIP Gateway configuration task list
Enter configuration mode
From-URI-Host equal Remote Request-URI-Host equal Local
Creating a context SIP gateway
Mode Transport Interface
Mode Context SIP Gateway
Creating a transport interface
Configuring the IP binding
Enabling/disabling the context SIP gateway
Binding location services
Configuring a spoofed contact address
Debug commands
Troubleshooting
Show status information
Node#show context sip-gateway gw
Example
Configuration Examples
Outbound Authentication
Inbound Authentication
Outbound Registration
569
Inbound Registration
B2B User Agent with Registered Clients
572
VoIP profile configuration
VoIP profile configuration
Creating a VoIP profile
VoIP profile configuration task list
Nodecfg#profile voip name
Nodepf-voip name#
Configure codecs
Procedure Insert a codec at a specific position in the list
Mode Profile VoIP
Procedure Remove a codec from the list Mode Profile VoIP
Configuring the Cisco versions of the G.726 codecs
Mode VoIP name
Configuring the transparent-clearmode codec
Configuring Dtmf relay
Defaultrtpsignaling
Configuring RTP payload types
Nodepf-voip pf-name#dtmf-relay
Configuring RTP payload type for Cisco NSE
Configuring RTP payload type for transparent-clearmode
Configuring Cisco NSE for Fax
Nodepf-voip name#rtp payload-type nse
Jitter and dejitter buffer
Configuring the dejitter buffer advanced
Adaptive
Procedure Configure the dejitter buffer
Dejitter buffer is allowed to introduce. This setting
Max-delay
Enabling/disabling filters advanced
Is valid for all modes
Illustrates the difference between Fax relay and Fax bypass
Configuring Fax transmission
Fax relay and Fax bypass
Sion bypass g711alaw64k
Nodepf-voipname#fax transmis
Nodepf-voipname#fax dejitter
Nodepf-voipname# fax transmis
Volume
Mode profile voip profile-name
CED retransmission
Retransmission number
Mode profile voip pf-name
No-Signal Retransmission
Method default v150-vbdnse Default default
Fax bypass method
Configuring modem transmission
Modem bypass method
Nodepf-voip name#modem trans
Mission bypass g711alaw64k
Configuring IP-IP codec negotiation
Configuring the traffic class for Voice and Fax data
Home office in an enterprise network
Home office in an enterprise network
Description
Home office with fax
Show the configured profile
Soft phone client gateway
595
Disable Dtmf relay Show the configured profile
Pstn profile configuration
Creating a Pstn profile
Pstn profile configuration task list
Procedure Disable echo cancellation Mode Profile Pstn
Configuring the echo canceller
Procedure Configure voice output gain
Configuring output gain
600
SIP profile configuration
SIP profile configuration task list
Entering the configuration mode for a SIP profile
Mapping from a SIP disconnect cause
Namecfg#no profile name name
Mapping from a SIP redirection reason
Mapping to a SIP cause
Mapping to a SIP redirection code
Q931-cause to sip-cause
Authentication Service
Creating an Authentication Service
Authentication Service configuration task list
Creating credentials
Configuring the authentication protocol
Configuring a Realm
Location Service
Creating a Location Service
Location Service configuration task list
Adding a domain
Domain Examples
Creating an identity
Mode Identity
Bound
Authentication outbound face
Alias
Authentication inbound face
Mode Authentication outbound
Nodeauthout#authenticate authentica
Nodeauthout#authenticate index
Nodeauthin#authenticate authentica
Mode Authentication inbound
Nodeauthin#authenticate index
Nodeauthin#no authenticate index
Registration outbound face
Mode Registration outbound
Strict-route
Noderegout#proxy host port
Port strict-route
Noderegout#proxy index down posi
Registration inbound face
Noderegin# no lifetime default sec
Nodeidentityname# no registration
Inbound
Call outbound face
Mode Call outbound
Nodecallout#proxy host port
Nodecallout#proxy index host
Call inbound face
Mode Call outbound
Mode Call inbound
Inheriting from an identity group to an identity
Creating an identity group
Subscription
Configuring the Message Waiting Indication feature for SIP
Notification
Mode Message inbound
Mode Message inbound
Message Waiting Indication through Call-Control
This configuration example, inheritance is used
VoIP debugging
Debugging strategy
Filtering debug monitor output
Following command will disable the filter completely
Verifying IP connectivity
Example Verify IP connectivity
Debugging Isdn signaling
Debugging call signaling
Unit#debug ccisdn signaling
Overview Isdn debug monitors
Verify an incoming call
Verify an outgoing call
Line
630
Debug isdn event slot port all layer2 layer3
Isdn layer 2 and 3 can be verified using a show command
Verify Isdn layer 2 and 3 status
Overview FXS debug monitors
Debugging FXS Signaling
Stops
For most verbose output
State to RINGING, that means it has accepted the call
Overview H.323 debug monitors
Debugging H.323 Signaling
635
636
637
Debugging SIP signaling
Using SmartWare’s internal call generator
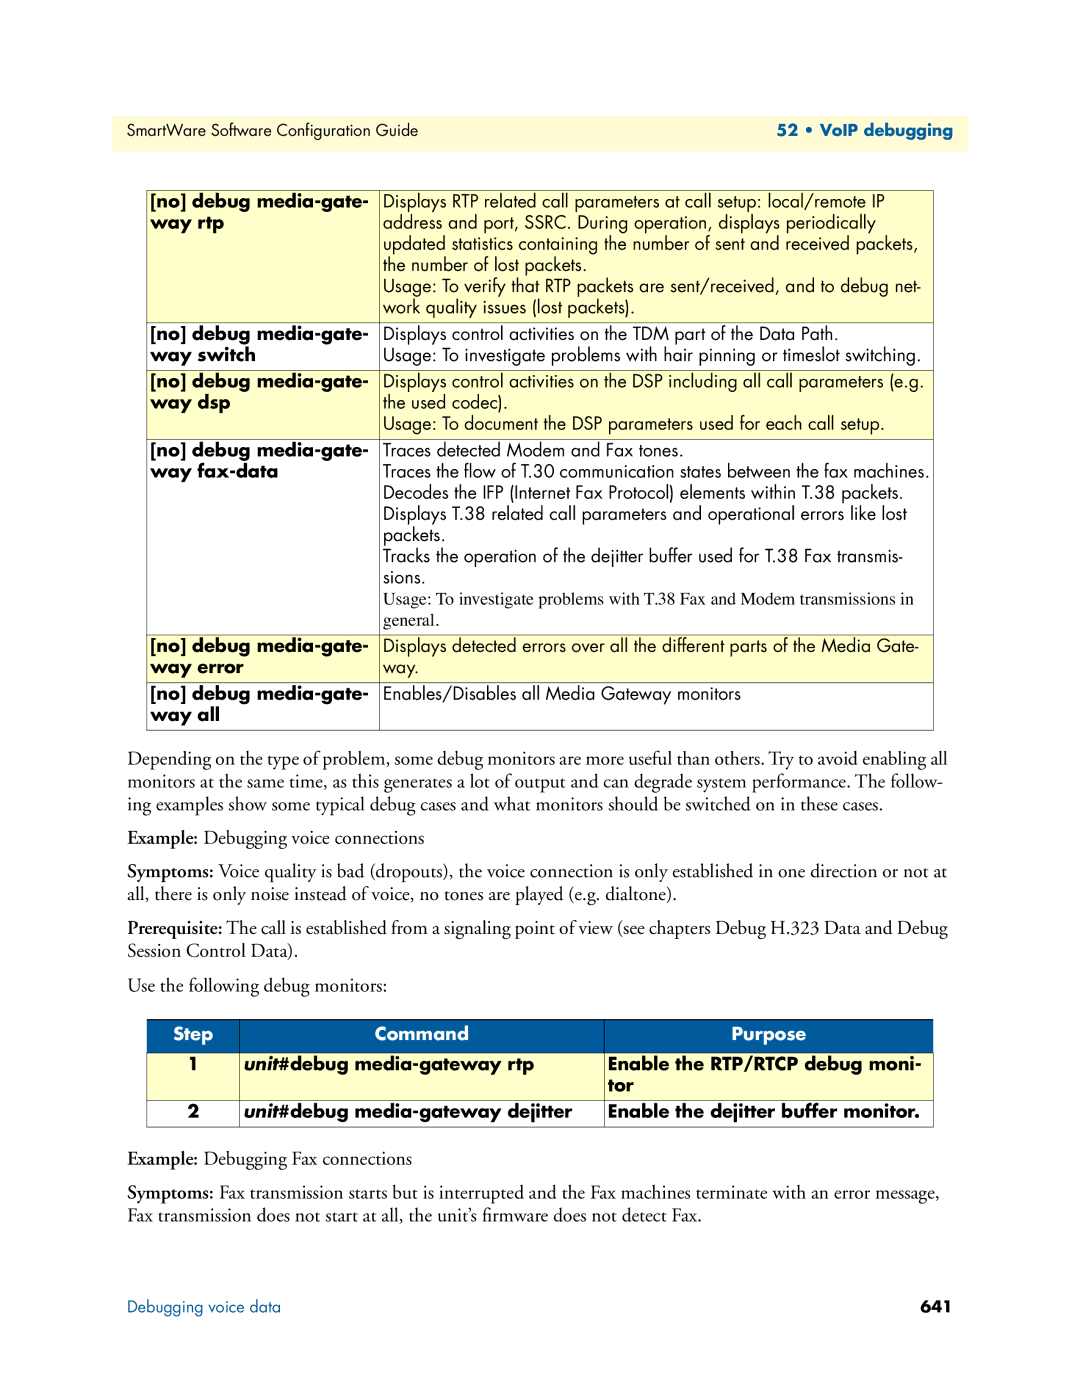
No debug media-gate
Debugging voice data
Way dejitter
Way control detail level
Way error
Way switch
Way rtp
Way dsp
Check system logs
How to submit trouble reports to Patton
643
Appendix a Terms and definitions
Also release
SmartWare architecture terms and definitions
Pression
Buffer
Ory
Pots
Tftp
Appendix B Mode summary
Mode overview, 1
Mode Overview, 2
Mode Overview, 3
Appendix C Command summary
Ebnf syntax
Show command history
New Configuration Commands
Other
Show help
Appendix D Internetworking terms & acronyms
Numeric
Abbreviations
DSS1
MSN
SAR
Appendix E Used IP ports & available voice Codecs
Webserver
Used IP ports
Telnet
Available voice codecs