Section 7 |
|
|
|
| |||||
|
|
|
|
|
|
|
|
|
|
|
|
|
|
|
|
|
|
|
|
|
|
| Siemens | 2 Channel | [1] | Channel 1 |
| ||
|
|
| Key Install to start flow measurement |
|
| ||||
|
|
|
|
|
|
|
|
|
|
|
|
|
| Transducer Model | 190 |
|
|
| |
|
|
|
| Transducer Size | 191 |
|
|
| |
|
|
|
| Flow Range GAL/MIN | 6.71 |
|
|
| |
|
|
|
| Install Completed? | Yes |
|
|
| |
|
|
|
| Spectra Graph | No |
|
|
| |
|
|
|
|
|
|
|
|
| |
|
|
| Install Xdcr |
|
|
|
|
| |
|
|
|
|
|
|
|
|
|
|
7.9 THE SPECTRA DISPLAY SCREEN
The Spectra Graph provides a powerful tool to determine if the installation has achieved an adequate margin of operation. It also eliminates the possible effects of mechanical vibration and external RFI (Radio Frequency Interference). Mechanical vibration and external RFI can cause other types of Dop- pler flowmeters to be inaccurate. The Spectra Graph screen provides keypad control keys that allow adjustments of application dependent parameters, if required, while observing the results of these adjustments. Application dependent parameters are the Low and High Limit Cursors and the Noise Cursor. In most cases, only the Noise Cursor will be required to be adjusted.
To display the Spectra Graph, position the highlight over Spectra Graph and use the <Right and Down Arrows> to select [Yes].
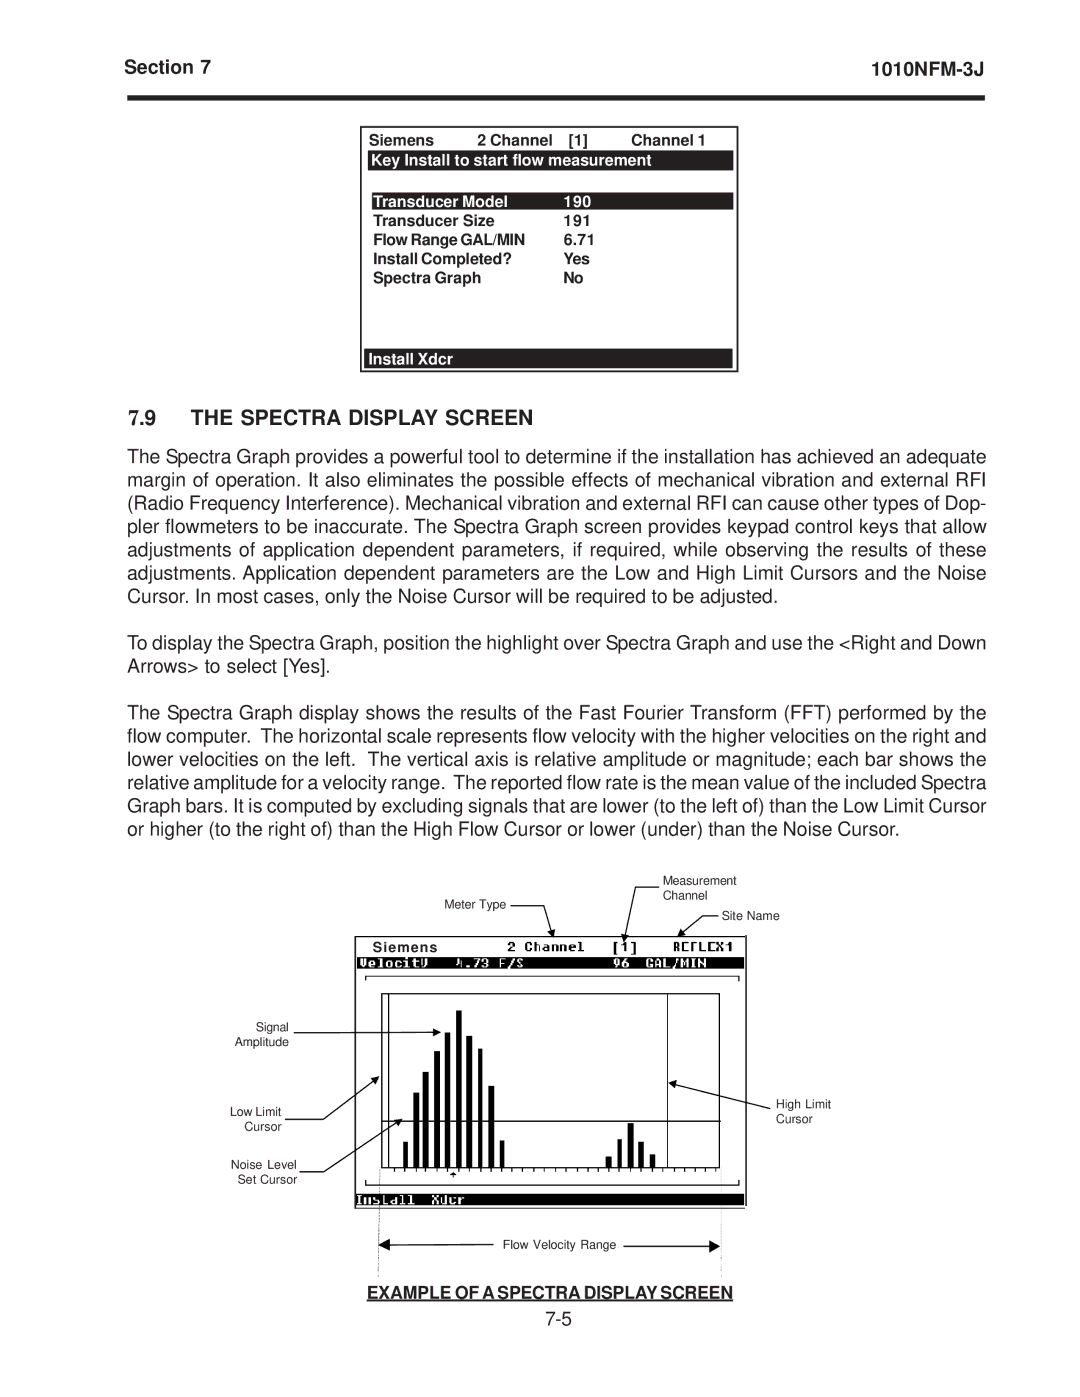
The Spectra Graph display shows the results of the Fast Fourier Transform (FFT) performed by the flow computer. The horizontal scale represents flow velocity with the higher velocities on the right and lower velocities on the left. The vertical axis is relative amplitude or magnitude; each bar shows the relative amplitude for a velocity range. The reported flow rate is the mean value of the included Spectra Graph bars. It is computed by excluding signals that are lower (to the left of) than the Low Limit Cursor or higher (to the right of) than the High Flow Cursor or lower (under) than the Noise Cursor.
SignalSignal
Amplitudel
Low
Limit
LowCursorLimit
Cursor
NoiseLevelLevel
SetSetCursorCursor
|
| Measurementsurement |
| |
Meter Type |
| Channelannel |
| |
Meter Type |
|
| Site name | |
|
|
| Site Name | |
Siemens
![]() HighHighLimitLimit
HighHighLimitLimit
CursorCursor
FlowFlowVelocityVelocityRangee
EXAMPLE OF A SPECTRA DISPLAY SCREEN