CACHE SUBSYSTEMS
| | OTHER BUS | | |
| | MASTER | | |
| _________ | } | NON·CACHEABLE |
1386" OX | | | | |
CPU | | | | |
CACHE | | MEMORY | } | CACHEABLE |
| |
~
231732i7·8
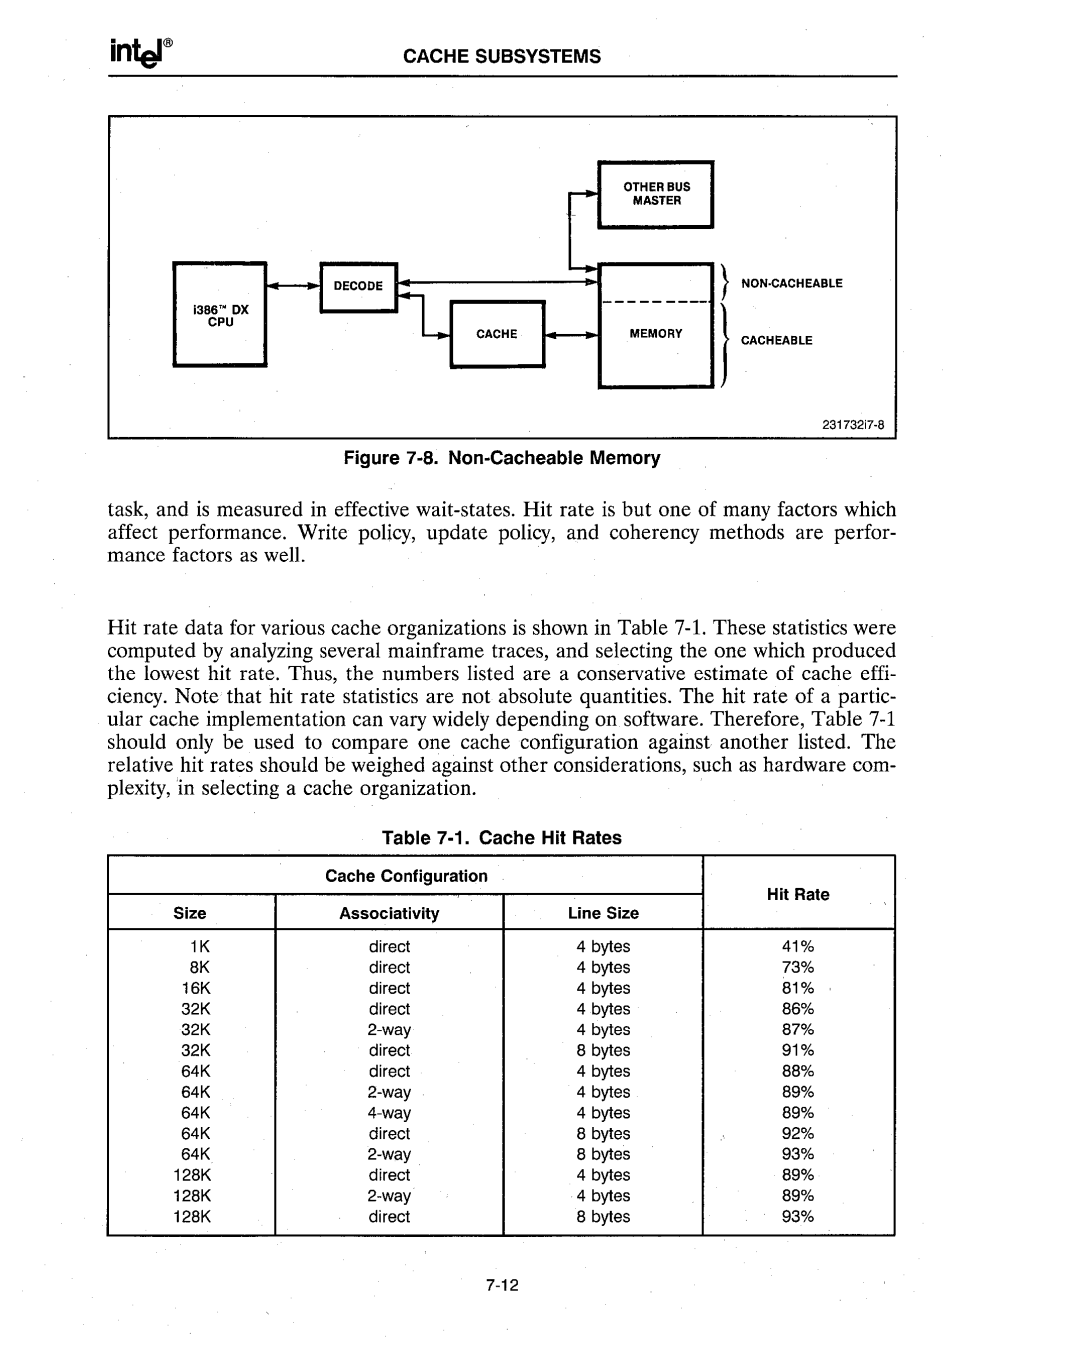
Figure 7-8. Non-Cacheable Memory
task, and is measured in effective wait-states. Hit rate is but one of many factors which affect performance. Write policy, update policy, and coherency methods are perfor- mance factors as well.
Hit rate data for various cache organizations is shown in Table 7-1. These statistics were computed by analyzing several mainframe traces, and selecting the one which produced the lowest hit rate. Thus, the numbers listed are a conservative estimate of cache effi- ciency. Note that hit rate statistics are not absolute quantities. The hit rate of a partic- ular cache implementation can vary widely depending on software. Therefore, Table 7-1 should only be. used to compare one cache configuration against another listed. The relative hit rates should be weighed against other considerations, such as hardware com- plexity, in selecting a cache organization.
Table 7-1. Cache Hit Rates
| Cache Configuration | | | |
| | | | Hit Rate |
Size | Associativity | Line Size | | |
1K | direct | 4 bytes | | 41% |
8K | direct | 4 bytes | | 73% |
16K | direct | 4 bytes | | 81% |
32K | direct | 4 bytes | | 86% |
32K | 2-way | 4 bytes | | 87% |
32K | direct | 8 bytes | | 91% |
64K | direct | 4 bytes | | 88% |
64K | 2-way | 4 bytes | | 89% |
64K | 4-way | 4 bytes | | 89% |
64K | direct | 8 bytes | .'. | 92% |
64K | 2-way | 8 bytes | | 93% |
128K | direct | 4 bytes | | 89% |
128K | 2-way | 4 bytes | | 89% |
128K | direct | 8 bytes | | 93% |
| 7-12 | | | |