The LAG Statistics page contains the following fields:
•Interface Statistics — Selects the interface statistics to display.
•Etherlike Statistics — Selects the Etherlike statistics to display.
•RMON Statistics — Selects the RMON statistics to display.
•GVRP Statistics — Selects the GVRP statistics type to display.
•Refresh Rate — Amount of time that passes before the statistics are refreshed.
Displaying LAG Statistics
1Open the LAG Statistics page.
2Select the statistic type to open.
3Select the desired refresh rate from the Refresh Rate
4Click Draw.
The graph for the selected statistic is displayed.
Viewing LAG Statistics Using the CLI Commands
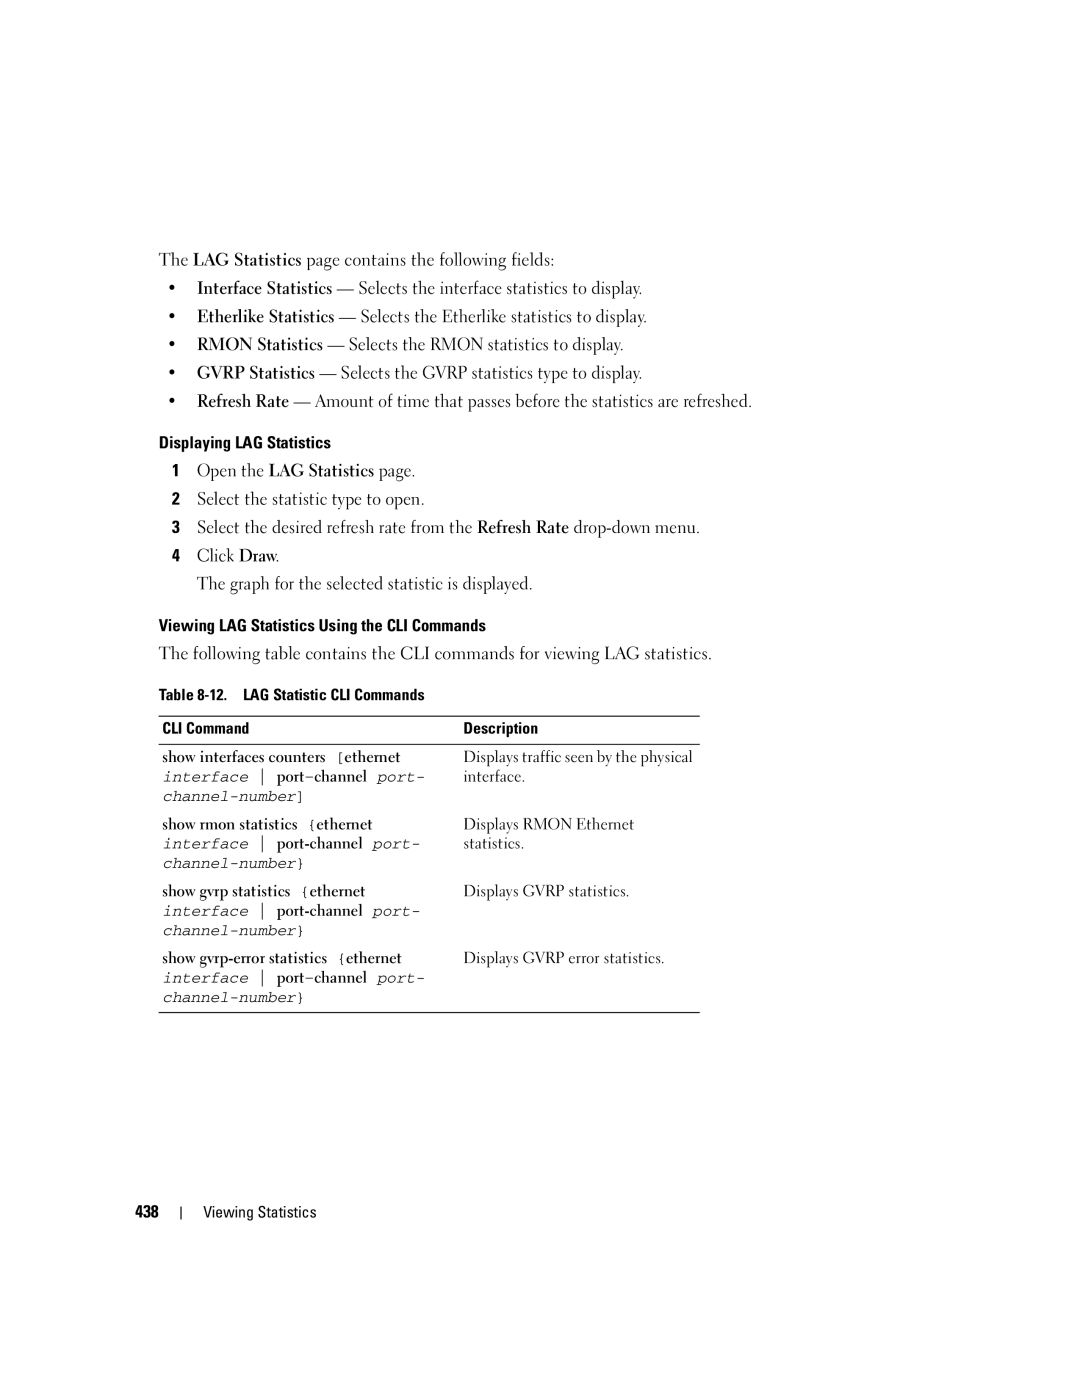
The following table contains the CLI commands for viewing LAG statistics.
Table
CLI Command | Description |
|
|
show interfaces counters [ethernet | Displays traffic seen by the physical |
interface | interface. |
| |
show rmon statistics {ethernet | Displays RMON Ethernet |
interface | statistics. |
| |
show gvrp statistics {ethernet | Displays GVRP statistics. |
interface |
|
| |
show | Displays GVRP error statistics. |
interface |
|
| |
|
|
