Chapter 20 Performance Management and Historical Data
Viewing the Performance Manager Window
Note The Performance Manager window cannot be opened when multiple objects are selected (the menu options to open the Cisco 12000/10720 Router Manager windows are grayed out). Available menu options can be launched from a site object containing the required objects, when required.
The Performance Manager window appears (see Figure 20-1).
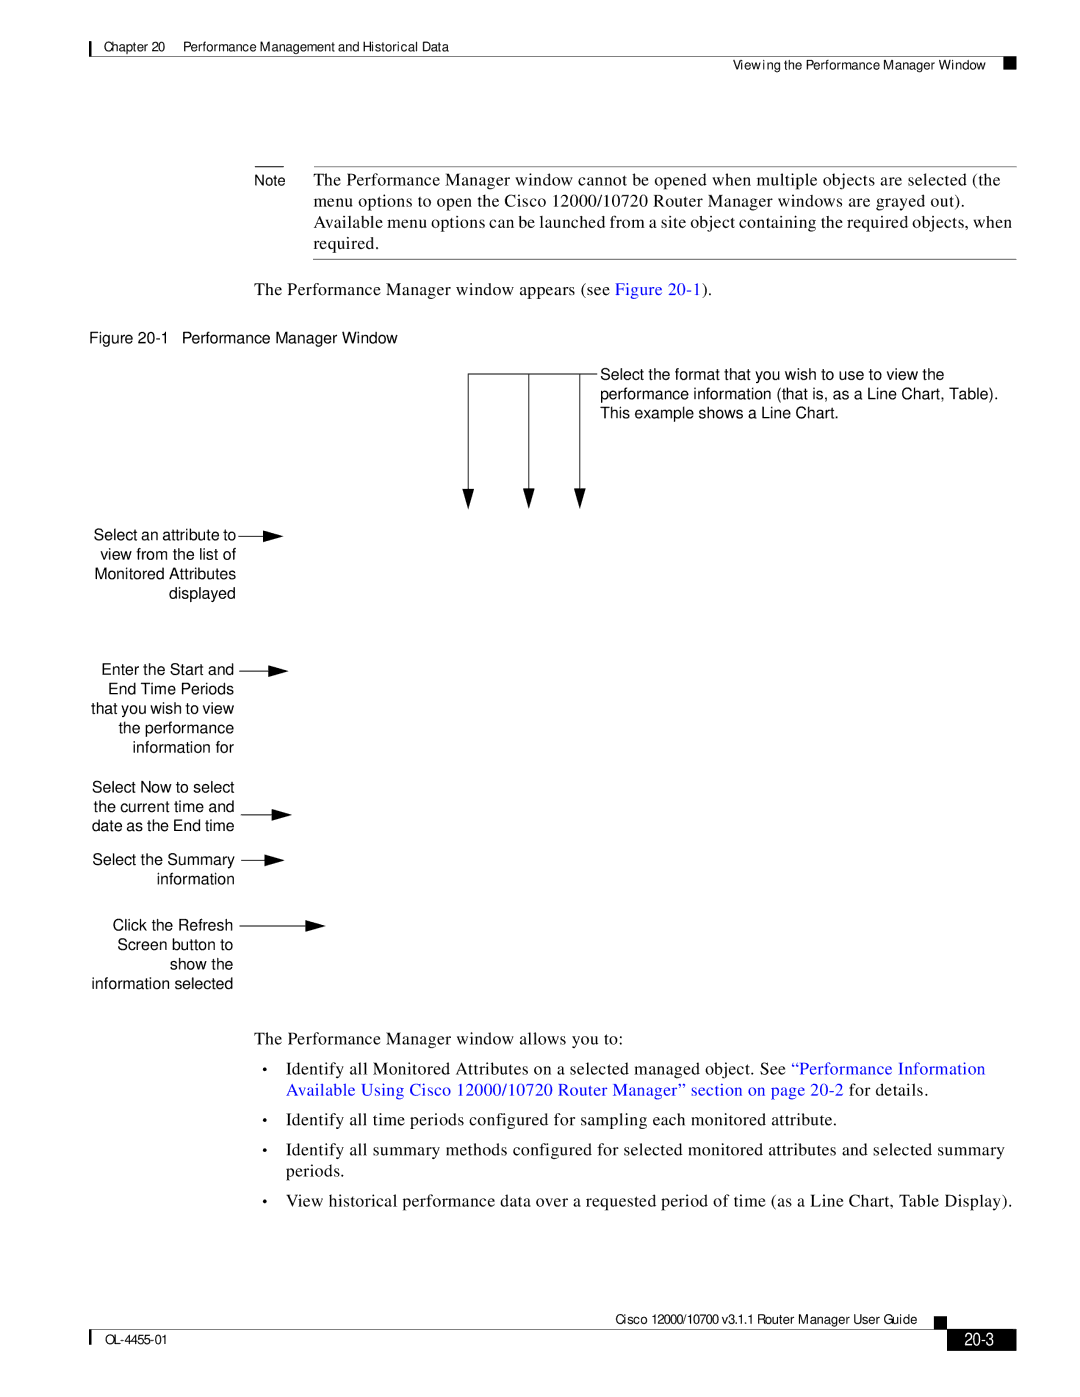
Figure 20-1 Performance Manager Window
Select an attribute to ![]()
![]() view from the list of Monitored Attributes
view from the list of Monitored Attributes
displayed
Enter the Start and ![]()
![]() End Time Periods
End Time Periods
that you wish to view the performance information for
Select Now to select the current time and date as the End time
Select the Summary ![]()
![]() information
information
Click the Refresh ![]()
![]() Screen button to
Screen button to
show the information selected
Select the format that you wish to use to view the performance information (that is, as a Line Chart, Table). This example shows a Line Chart.
The Performance Manager window allows you to:
•Identify all Monitored Attributes on a selected managed object. See “Performance Information Available Using Cisco 12000/10720 Router Manager” section on page
•Identify all time periods configured for sampling each monitored attribute.
•Identify all summary methods configured for selected monitored attributes and selected summary periods.
•View historical performance data over a requested period of time (as a Line Chart, Table Display).
Cisco 12000/10700 v3.1.1 Router Manager User Guide
|
|
| |
|
|