Examples of Reports
Reporting in HP Web Jetadmin shows data change over time. A very simple report could be simple device page count on a single device. After data collection has been established and multiple page counts exist in the database, a report can be displayed that shows the page count change (if any) in a selected time interval. (See Device Utilization on page 206).
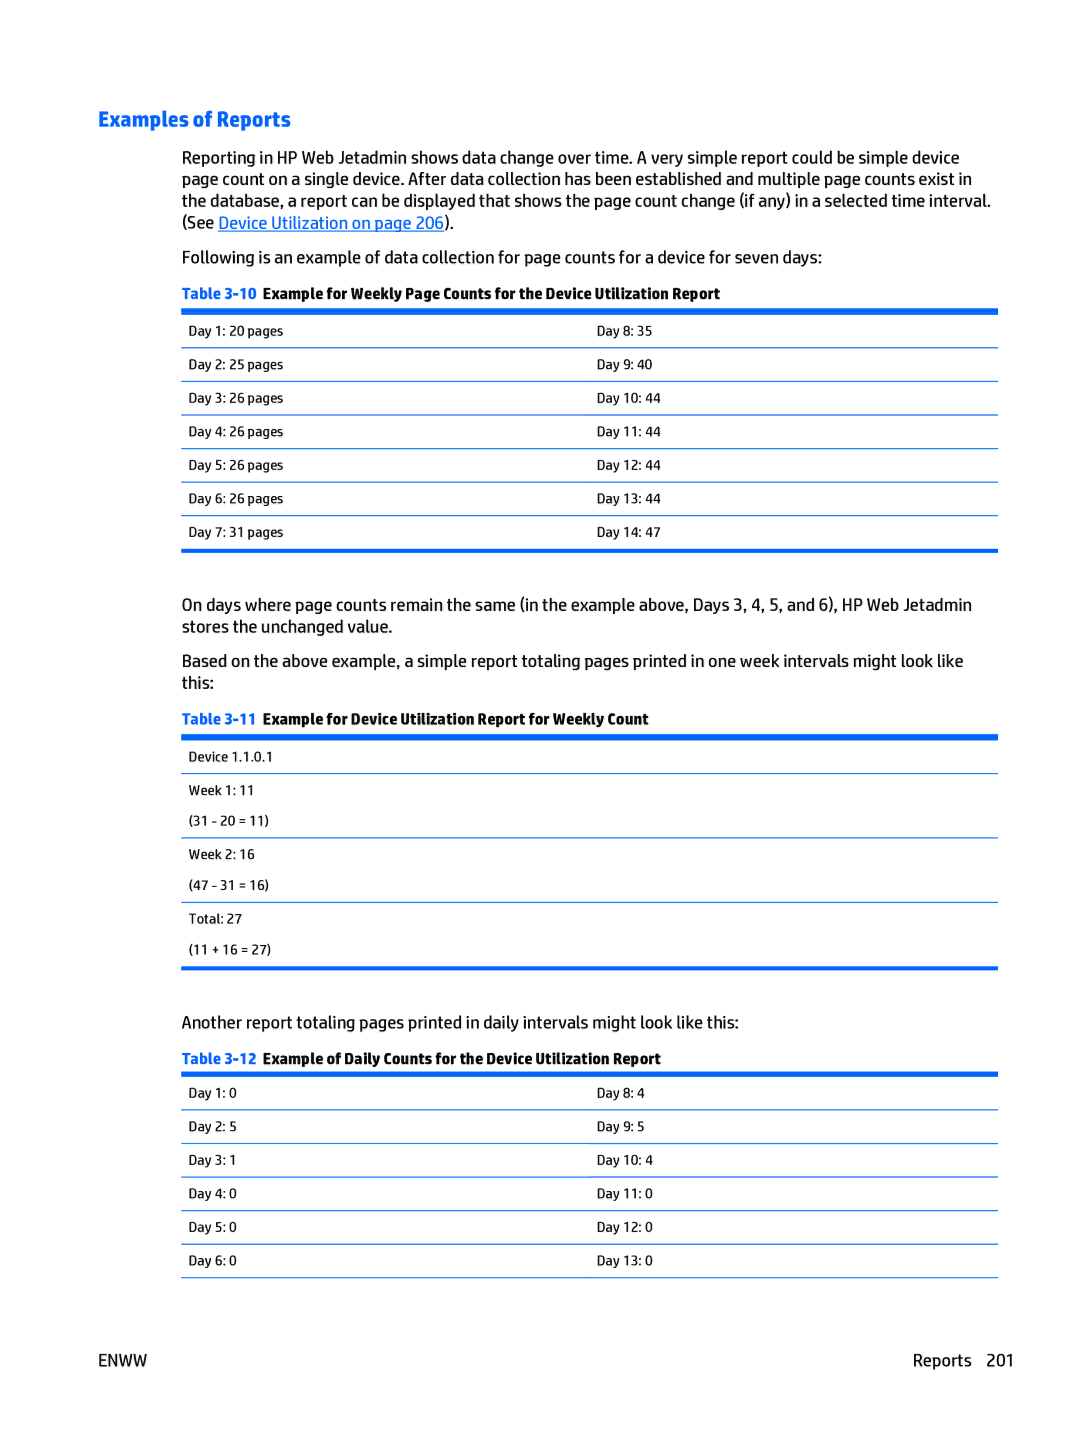
Following is an example of data collection for page counts for a device for seven days:
Table
Day 1: 20 pages | Day 8: 35 |
|
|
Day 2: 25 pages | Day 9: 40 |
|
|
Day 3: 26 pages | Day 10: 44 |
|
|
Day 4: 26 pages | Day 11: 44 |
|
|
Day 5: 26 pages | Day 12: 44 |
|
|
Day 6: 26 pages | Day 13: 44 |
|
|
Day 7: 31 pages | Day 14: 47 |
|
|
On days where page counts remain the same (in the example above, Days 3, 4, 5, and 6), HP Web Jetadmin stores the unchanged value.
Based on the above example, a simple report totaling pages printed in one week intervals might look like this:
Table
Device 1.1.0.1
Week 1: 11 (31 - 20 = 11)
Week 2: 16 (47 - 31 = 16)
Total: 27
(11 + 16 = 27)
Another report totaling pages printed in daily intervals might look like this:
Table
Day 1: 0 | Day 8: 4 |
|
|
Day 2: 5 | Day 9: 5 |
|
|
Day 3: 1 | Day 10: 4 |
|
|
Day 4: 0 | Day 11: 0 |
|
|
Day 5: 0 | Day 12: 0 |
|
|
Day 6: 0 | Day 13: 0 |
|
|
ENWW | Reports 201 |
