Dell Command Line Reference Guide for the S6000 System 70.0
Page
Contents
Control and Monitoring
Access Control Lists ACL 182
802.1X 160
184
239
Boot Command Line Interface 323
Bidirectional Forwarding Detection BFD 317
Border Gateway Protocol 336
375
Control Plane Policing CoPP 471
Content Addressable Memory CAM 459
Data Center Bridging DCB 478
Debugging and Diagnostics 522
Dynamic Host Configuration Protocol Dhcp 546
Equal Cost Multi-Path Ecmp 583
Flex Hash and Optimized Boot-Up 591
FCoE Transit 596
Force10 Resilient Ring Protocol Frrp 612
Garp Vlan Registration Gvrp 623
Interfaces 664
23 IPv4 Routing 742
743
24 IPv6 Basics 818
25 IPv6 Access Control Lists IPv6 ACLs 830
Intermediate System to Intermediate System IS-IS 840
849
Link Aggregation Control Protocol Lacp 910
Layer 918
Link Layer Discovery Protocol Lldp 953
Microsoft Network Load Balancing 976
Multicast Source Discovery Protocol Msdp 979
Multiple Spanning Tree Protocol Mstp 995
Multicast 1012
Neighbor Discovery Protocol NDP 1021
Object Tracking 1039
Open Shortest Path First OSPFv2 and OSPFv3 1059
1090
PIM-Sparse Mode PIM-SM
Policy-based Routing PBR
Private Vlan Pvlan 1222
Port Monitoring 1214
Per-VLAN Spanning Tree Plus PVST+ 1228
Quality of Service QoS 1245
Routing Information Protocol RIP 1301
Rapid Spanning Tree Protocol Rstp 1346
Remote Monitoring Rmon 1329
Security 1360
1365
1406
SFlow 1463
Service Provider Bridging 1456
Simple Network Management Protocol Snmp and Syslog 1475
Snmp Traps 1524 Stacking 1530
Spanning Tree Protocol STP 1551
Storm Control 1541
System Time and Date 1566
Vlan Stacking 1595
Tunneling 1585
Virtual Routing and Forwarding VRF 1607
VLT Proxy Gateway 1620
Virtual Link Trunking VLT 1626
Virtual Extensible LAN Vxlan 1648
Virtual Router Redundancy Protocol Vrrp 1660
1681
About this Guide
References
Objectives
Audience
Information Icons
Multiple Configuration Users
Accessing the Command Line
CLI Basics
Keywords at Any command Mode To obtain a list
Partial Keywords using Example
Obtaining Help
To obtain a list
Key Combination Action
Esc B
Esc F
Esc D
Filtering show Commands
Using the Keyword no Command
Navigating the CLI
Filtering the Command Output Multiple Times
Displaying All Output
Ethernet Show run
Grep Ethernet Ignore-case No-more
Feature vrf
Show feature
Show feature
Command
Command Modes
BGP ADDRESS-FAMILY Mode
CLASS-MAP Mode
Configuration Mode
CONTROL-PLANE Mode
Dhcp Mode
Dhcp Pool Mode
Ecmp Group Mode
Exec Mode
Exec Privilege Mode
Extended Community List Mode
Frrp Mode
IP Access List Mode
Isis ADDRESS-FAMILY Mode
Dellconf-if# Interface mode
Prompt
Lldp Mode
Lldp Management Interface Mode
Line Mode
MAC Access List Mode
Multiple Spanning Tree Mstp Mode
Openflow Instance Mode
Per-VLAN Spanning Tree PVST+ Plus Mode
PORT-CHANNEL FAILOVER-GROUP Mode
PREFIX-LIST Mode
Protocol Gvrp Mode
Rapid Spanning Tree Rstp Mode
ROUTE-MAP Mode
Router Isis Mode
Router Ospf Mode
Router OSPFV3 Mode
Router RIP Mode
Spanning Tree Mode
TRACE-LIST Mode
VLT Domain Mode
Vrrp Mode
Boot system
File Management
Command Modes Command History Usage Information
Version Description 70.0
Parameters
Directory
Series Original command
Http Copy via CLI
Copy http
Flash
Enter http http//hostip
Copy
Filepath
Flash
40.0
Usage Information Example VersionDescription
Commands
Delete
FTOS#
Related
Command Modes Command History No-confirm
Dir
Filename
Name
Series
Modes Command
Usage Information Related Commands VersionDescription 70.0
Format flash S-Series
Fsck flash
VersionDescription 70.0
Mkdir
Introduced on S4810 and Z9000
Password Optional Enter the password
Mount nfs
Rmdir
Dell#mkdir nfsmount/nfs-mountpoint/guest
Upgrade system
00.0 Version
19.0 Version
Rename
Rename url url
Url
Version Description
Show boot system
Syntax Parameters Defaults Command Modes Command History
Flash Boot
All
Show bootvar
Syntax Command Modes Command History Example
Show file-systems
Version Description 70.0 Introduced on the S6000-ON
Command Modes Command History Example Command Fields
Feature
Field Description Sizeb
Freeb
File-url
Show os-version
Release Image Information
Show running-config
Boot
Bgp
Cam-profile
Class-map
Logging
Mac
Mac-address
Management
Sflow
Snmp
Spanning
Tree
File Management
Show startup-config
Show startup-config
Example Related Commands VersionDescription 70.0
Show version
Show version
SRC
Srcc
S6000
Upgrade boot
Bootflash
Bootselector
Booted
00.0 Version
Verify
Verify md5 sha256 flash// img-filehash-value
Img-file
Hash-value
Control and Monitoring
Banner exec
Banner exec c line c
Line
Banner login
Line c
Interactive
Banner motd
Defaults Command Modes Command History
Banner motd c line c
Usage Information Related Commands VersionDescription
Cam-acl
Command History Usage Information
20.2 0.0
Clear line
Line-number
Aux
Console
Configure
Configure terminal
Command Modes Command History Example
Dell#configure Dellconf#
Disable
Disable level
Command
Level
Enable
Command History Usage Information Example
Enable level
Optional Enter a number for a privilege level of Dell
Enable optical-info-update interval seconds
Enable optic-info-update interval
Info-update interval command
Seconds
End
End
Exec-timeout
Command History Related Commands
Exec-timeout minutes seconds
Minutes
Exit
Command Modes Command History Usage Information Example
Dell con0 is now available Press Return to get started
Ftp-server vrf vrf-name enable
Ftp-server enable
Vrf vrf-name
Command History Example
Ftp-server topdir
Ftp-server topdir directory
Enter the directory path
Syntaxftp-server username username password encryption-type
Ftp-server username
Password
Hostname
Encryption
Type
Ip ftp password
Password password command
Command History Usage Information Related Commands
Ip ftp source-interface
Ip ftp source-interface interface
Interface
Ip tftp vrf vrf-name
Ip tftp vrf
Specify the VRF that is used by the Tftp client
Ip ftp username
Parameters Defaults Command Modes Command History
Ip ftp username username
Ip ftp vrf
Ip telnet server enable
Ip telnet server enable
Ip telnet server vrf
Ip telnet source-interface
Vrf
Management
For Loopback interfaces, enter the keyword loopback
Related Telnet telnet to another device Commands
Commands IP access control list ACL
Line
Line aux 0 console 0 vty number end-number
End-number
Ping
Motd-banner
Motd-banner
Timeout
Host
Ipv6-address
Count
Validate-reply
Outgoing
Sweep-min
Size
Usage Information Example IPv4 Version
Nvram-cfg
Reload
Change
Send * line console vty
Send
Vty
Service timestamps
Show alarms
Show running-config command
Show alarms threshold
Parameters Threshold
Show command-tree count no
Show command-tree
Count
Show cpu-traffic-stats port number all cp
Show cpu-traffic-stats
Port number
All
No CPU traffic statistics Dell#
Show debugging
Show debugging
Show environment
Fan
Stack-unit unit
Pem
Unknown
Show inventory media slot
Show inventory
Media slot
08YWFG
0T9FNW
0MGDH8
Lldp
Show memory stack-unit id
Show memory
Parameters Stack-unit id
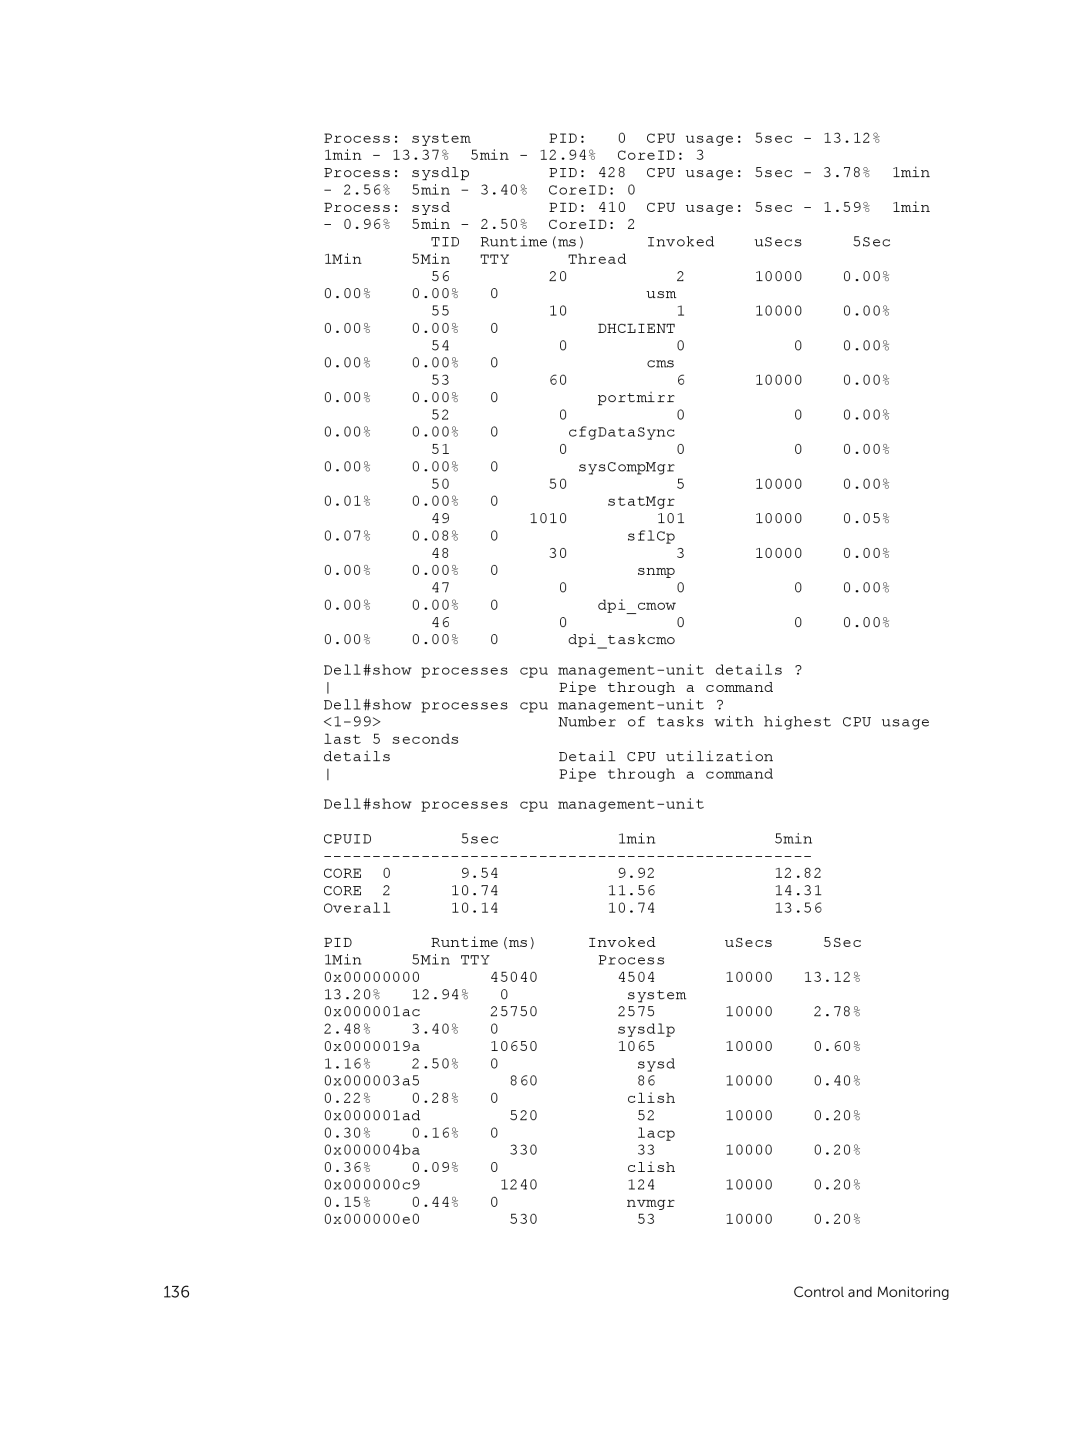
Show processes cpu
Unit
Details
Summary
UNIT0
Cpuid
Core
PID
TTY
TID
Dhclient
Show processes ipc flow-control
Show processes ipc flow-control cp
Show processes ipc flow-control cp rp1 rp2 stack-unit
Rp1
Defaults Command Modes Command History Usage Information Rp2
Show processes memory
Memory output
Show processes
Process ID
Example Example management- unit
Defaults Command Modes Command History Trace-flags
Show software ifm
Clients
Ifagt number
Show system
Stack-unit unit- id disabled- ports
Brief
Type command. Modified the show system stack-unit
Stack-ports Optional Enter the keywords stack-ports for
Status
Information about the status or topology of the stack ports
145
146 Control and Monitoring
Example S6000-ON
Show tech-support stack-unit unit-id
Show tech-support
Save
Usage Information Example S- Series
150 Control and Monitoring
Ssh-peer-stack-unit
Telnet
Hardware watchdog stack-unit
Ssh-peer-stack-unit -l username
Host
Prefix-length
Vrf instance
Source
Defaults Not configured Command
Telnet-peer-stack-unit
Dell#telnet vrf vrf1
Telnet-peer-stack-unit
Terminal length
Terminal length screen-length
Traceroute
156 Control and Monitoring
Undebug all
Undebug all
Virtual-ip
Startup-config command
Write
Write memory compressed terminal
Memory
802.1X
Important Points to Remember
Disabled Exec Privilege
Debug dot1x
Dot1x auth-fail-vlan
Syntaxdot1x auth-fail-vlan vlan-idmax-attempts number
Configuration conf-if-interface-slot/port
Vlan-id Enter the Vlan Identifier. The range is from 1 to
Dot1x auth-server
Dot1x auth-type mab-only
Dot1x auth-server radius
Dot1x auth-type mab-only
Dot1x authentication Configuration
Dot1x authentication
Dot1x authentication Interface
Dot1x guest-vlan
Dot1x guest-vlan vlan-id
Vlan-id Enter the Vlan Identifier. The range is from 1 to
Usage Information VersionDescription 70.0
Dot1x host-mode
Dot1x host-mode single-host multi-host multi-auth
Single-host
Multi-host
Dot1x mac-auth-bypass
Defaults Command Modes Command History Usage Information
Dot1x mac-auth-bypass
Dot1x max-eap-req
Dot1x max-supplicants
Dot1x max-eap-req number
Number
Dot1x port-control
Auto
Dot1x quiet-period
Dot1x quiet-period seconds
Dot1x reauthentication
Dot1x reauthentication interval seconds
Dot1x server-timeout
Dot1x server-timeout seconds
Dot1x reauth-max
Dot1x reauth-max number
Dot1x supplicant-timeout
Dot1x supplicant-timeout seconds
Dot1x tx-period
Parameters Defaults Command Modes Command History Seconds
Dot1x tx-period seconds
Show dot1x cos-mapping interface interface mac-address mac
Show dot1x cos-mapping interface
Mac-address
177
Dot1x Status Enable
Show dot1x interface
Show dot1x interface interface mac-address mac-address
Dell#show dot1x interface tengigabitethernet 1/32
Example mac- address
Dot1x Status Enable Port Control
AUTHORIZEDGUEST-VLAN
181
Access Control Lists ACL
Commands Common to all ACL Types
Remark
Remark
Description Enter a description of up to 80 characters
Show config
Show config
Access-class
Common IP ACL Commands
Access-list
Clear counters ip access-group
Ip access-group
Characters
Enter the keyword in to apply the ACL to incoming traffic
Implicit-permit
Vlan vlan-id
Ip control-plane egress-filter
Show ip accounting access-list
Name Camcount
Accounting Access-lists
Show ip
Field Extended IP
Seq
Deny
Standard IP ACL Commands
Any
Configuration Guide
Ip access-list standard
Ip access-list standard access-list-name
Mask
Permit
Host ip-address
Resequence access-list
Seq
Mac
Name StartingSeqNu
Step-to
Sequence
Extended IP ACL Commands
Destination
Ip-protocol
Byte
Monitor
Deny icmp
Optional Enter the keyword byte to count bytes
Bit
Deny tcp
Operator
Defaults Command Modes Command History Count
Port port Destination Mask
204
Deny udp
Total Ports
Port port
207
Ip access-list extended
Ip access-list extended access-list-name
Dellconfig-ext-nacl#
Dellconf#ip access-list extended TESTListEXTEND
Any host ip-address count bytes dscp value order fragments
210
Permit tcp
Operator
Numbers if you are using the range logical operand.
213
Permit udp
Range is 0 to
216
Ipv4 mac
Tcp
Icmp
Udp
Optional Enter the application layer port number. Enter
Access Control Lists ACL
Clear counters mac access-group
Common MAC Access List Commands
Clear counters mac access-group mac-list-name
Mac access-group
Vlan vlan-range
Show mac access-lists access-list-name interface interface
Show mac access-lists
Out
Show mac accounting access-list
Show mac accounting access-list access-list-nameinterface
Standard MAC ACL Commands
Count byte log monitor
Address Mac-source
Mac-source
Address-mask
Mac access-list standard
Mac access-list standard mac-list-name
Syntaxpermit any mac-source-address mac-source-address-mask
229
To remove this filter, use the no seq sequence-numbercommand
Extended MAC ACL Commands
Usage Information Related Commands
Byte log monitor
Parameters Any Host mac- address
Mac-source- address
Mac- destination- address
Mac access-list extended
Syntaxmac access-list extended access-list-namecpu-qos
Cpu-qos
Mac
Address
Destination Address-mask
IP Prefix List Commands
Clear ip prefix-list
Clear ip prefix-list prefix-name
Prefix-name
Related Ip prefix-list configures a prefix list Commands
Ip-prefix
Ge min-prefix
Length
Ip prefix-list
Ip prefix-list prefix-name
Version Description 1.0
Ip-prefix /nn
Show config
Dellconf-nprefixl#show config
Show ip prefix-list detail
Ip prefix-list snickers
Dellconf-nprefixl#
Show ip prefix-list summary
Route Map Commands
Continue
Description description
Description
Description
Match as-path
Match as-path as-path-name
Match community
Pre-6.1.1.0
Community
List-name
Match interface
Match interface interface
Related Commands VersionDescription
Match ip address
Match ip address prefix-list-name
Prefix-list
Match ip next-hop
Match ip route-source
Match metric metric-value
Match metric
Metric-value
Related Commands VersionDescription 70.0
Match origin
Parameters Egp
Igp
Match route-type
Match tag tag-value
Match tag
Tag-value
Route-map
Syntaxroute-map map-namepermit deny sequence-number
Map-name
Is permit
Set as-path
Dellconf#route-map dempsey Dellconfig-route-map#
Set as-path prepend as-number
Set automatic-tag
To return to the default, enter no set automatic-tag
Set automatic-tag
Set comm-list delete
Set comm-list community-list-name delete
Set community
Local-AS
No-advertise
No-export
None
Additive
Set level
Backbone
Level-1-2
Stub-area
Set local-preference value
Set local-preference
Value
Set metric + metric-value
Set metric
7.0
Set metric-type
Set metric-type internal external type-1 type-2
Type-1
Type-2
Set next-hop ip-address
Set next-hop
Ip-address Specify an IP address in dotted decimal format
Set tag
Set origin
Set origin igp egp incomplete
Set weight weight
Set weight
Weight
Router-originated = 32768 all other routes = Not configured
Show route-map
Version Description 7.0 Introduced on the S4810 1.0
Ip prefix-list PLOSPFtoRIP
Show route-map map-name
Example Related Commands VersionDescription Pre-6.1.1.0
Parameters Defaults Log
Deny for Standard IP ACLs
Threshold-in
Deny for Extended IP ACLs
30.0
273
Seq for Standard IPv4 ACLs
Parameters Log
275
Deny tcp for Extended IP ACLs
Deny ether-type for Extended MAC ACLs
278
Deny for Standard MAC ACLs
Deny for Extended MAC ACLs
281
Use the no permit source mask any host ip-address command
Permit for Standard IP ACLs
283
Permit arp for Extended MAC ACLs
Permit ether-type for Extended MAC ACLs
Use the no permit ether-type protocol-type-number
Defaults Command Modes Command History Usage Information
CONFIGURATION-STANDARD-ACCESS-LIST
Permit icmp for Extended IP ACLs
Permit udp for Extended IP ACLs
Usage Information Version Description 40.0
289
Permit for Extended IP ACLs
291
Command History Usage Information Version Description 70.0
Permit for Standard MAC ACLs
Seq for Standard MAC ACLs
Version Description 70.0
CONFIGURATION-EXTENDED-ACCESS-LIST
Permit tcp for Extended IP ACLs
Usage Information Related Commands Version Description 40.0
Seq arp for Extended MAC ACLs
Commands. You can enter a threshold in the range
Seq ether-type for Extended MAC ACLs
Seq sequence-number deny permit ether-type protocol-type
Byte order log interval minutes threshold-in-msgs
Count monitor
299
Seq for IP ACLs
Seq for IPv6 ACLs
Icmp ip tcp udp source address mask any host ipv6
Operator port port count byte log interval minutes
Threshold-in-msgs count monitor
ACCESS-LIST
Permit udp for IPv6 ACLs
Permit tcp for IPv6 ACLs
305
Permit icmp for IPv6 ACLs
ACCESS-LIST
Permit for IPv6 ACLs
Version Description 70.0
Deny udp for IPv6 ACLs
Deny arp for Extended MAC ACLs
Vlan-idip-address any opcode code-number count byte
Order log interval minutes threshold-in-msgs count monitor
Deny tcp for IPv6 ACLs
Deny icmp for Extended IPv6 ACLs
Deny icmp source address mask any host ipv6-address
Deny for IPv6 ACLs
316
Bidirectional Forwarding Detection BFD
Bfd all-neighbors
Router BGP Router Isis
Ip route bfd
Milliseconds
Neighbor bfd
Peer-group
Neighbor bfd disable
322 Bidirectional Forwarding Detection BFD
Boot Command Line Interface
Boot change
Default
Primary
Boot message
Bootuser # boot change primary
Boot device ftp
Bootuser #
Boot show net config retries
Boot write net config retries
Defaults Command Modes Command History Example
Syntax Boot write net config retries int Command
Boot zero
Defaults Command Modes
Default-gateway
Ignore enable-password
Bootadmin # etheraddr aaaaaaaaaaaa
Syntax Command Modes Command History Usage Information
Etheraddr macaddr
Related Reload Exit from this mode and reload Ftos Commands
Ignore startup-config
Interface management ethernet ip address
Modes Command History Usage Information Example
Syntax Reload Command
Modes Command Version Introduced on the S6000 History
Nvram erase
Command Modes History Example Serial
Syntax Show bootvar Command
Bootuser # show bootvar
Serial console
Syntax Show default-gateway Command
Show default-gateway
Bootuser # show default-gateway
Bootadmin #
Show interface management ethernet
Show serial console baud rate
Syntax Show serial console baudrate
Parameters Enable
Disable
Settimeout
Watchdog string
Watchdog Timeout
Border Gateway Protocol
BGP IPv4 Commands
Address-family
Ipv4 vrf vrf
Ipv6 unicast
Aggregate-address
Format A.B.C.D and mask in /prefix format /x
Bgp add-path
Usage Information VersionDescription
Bgp add-path send receive both path-count
Parameters Send
Bgp always-compare-med
Both
Path-count
Bgp always-compare-med
Bgp asnotation
Asnotation command
Bgp asnotation asplain asdot+ asdot
Bgp bestpath as-path ignore
Dellconf-routerbgp#bgp asnotation asdot
Dellconf-routerbgp#bgp asnotation asdot+
Dellconf-routerbgp#bgp asnotation asplain
Bgp bestpath as-path multipath-relax
Bgp bestpath as-path multipath-relax
Bgp bestpath med confed
Bgp bestpath med missing-as-best
Bgp bestpath Med confed
Bestpath med
Bgp bestpath router-id ignore
Bgp bestpath router-id ignore
Bgp client-to-client reflection
Reflection command
Bgp client-to-client reflection
Bgp cluster-id
Bgp cluster-id ip-address number
Bgp confederation identifier as-number
Bgp confederation identifier
As-number
Bgp confederation peers
Bgp confederation peers as-number...as-number
Bgp dampening
Route-map map-name
Half-life
Reuse
Suppress Max-suppress- time
Route-map map-name
Bgp default local-preference
Bgp default local-preference value
Bgp dmzlink-bw
Bgp enforce-first-as
Bgp dmzlink-bw
Dmzlink-bw
Bgp fast-external-fallover
Bgp fast-external-fallover
Bgp four-octet-as-support
Restart-time
Bgp graceful-restart
Stale-path-time
Defaults Command Modes Command History Role receiver
Bgp non-deterministic-med
Only
Bgp non-deterministic-med
Bgp recursive-bgp-next-hop
Bgp recursive-bgp-next-hop
Bgp regex-eval-optz-disable
Bgp regex-eval-optz-disable
Border Gateway Protocol
Bgp router-id
Bgp router-id ip-address
Clear ip bgp
429496729
65535.65
535
Clear ip bgp dampening
Ipv4 unicast
Ipv4-address
Clear ip bgp flap-statistics
Filter-list as
Path-name
Regexp regular
Clear ip bgp peer-group
Parameters Command Modes Command History
Debug ip bgp
Xxxxx
Debug ip bgp dampening
0.0 Added support for VRF
Xxxxx peer-group peer-group-name events in out command
Debug ip bgp events
Ipv4 multicast
Ipv6 unicast
Parameters Command Modes Command History Usage Information
Debug ip bgp keepalives
VRF to display BGP keepalive information corresponding
Debug ip bgp notifications
VersionDescription 70.0 Added ipv6 support
Debug ip bgp soft-reconfiguration
VersionDescription 70.0 Added support for VRF
Debug ip bgp updates
Default-metric
Default-metric number
Defaults Command
Deny bandwidth
Parameters Bandwidth
Parameters Enter a description to identify the BGP protocol
Maximum-paths
Pre-7.7.1.0 Introduced
Maximum-paths ebgp ibgp number
Ebgp
Neighbor activate
Activate
Neighbor add-path
Group-name advertisement-interval command
Neighbor advertisement-interval
Neighbor advertisement-start
Syntaxneighbor ip-address advertisement-start seconds
Neighbor allowas-in
Neighbor default-originate
Route-map
Neighbor description
Name Text
Neighbor distribute-list
Peer-group- name Prefix-list- name
Syntaxneighbor ip-address peer-group-name ebgp-multihop ttl
Neighbor ebgp-multihop
Ttl
Neighbor fall-over
Prepend
Neighbor local-as
No prepend
Neighbor maximum-prefix
Threshold warning-only
Name Maximum
Threshold
Neighbor password
Type password
Parameters Defaults Command Modes
Ip-address Peer-group- name Encryption- type Password
Neighbor peer-group assigning peers
Neighbor ip-address peer-group peer-group-name dmzlink-bw
Added the dmzlink-bw parameter
Neighbor peer-group creating group
Neighbor peer-group-name peer-group
Neighbor peer-group passive
Syntaxneighbor peer-group-namepeer-group passive sessions
Neighbor remote-as
Neighbor remove-private-as
Syntaxneighbor ip-address peer-group-name remove-private-as
Neighbor route-map
Neighbor ip-address peer-group-nameroute-mapmap-name
Neighbor route-reflector-client
Ip-address Peer-group- name
Neighbor shutdown
Neighbor ip-address peer-group-name shutdown
Neighbor soft-reconfiguration inbound
Format
Neighbor timers
Keepalive
Holdtime
Neighbor update-source
Neighbor weight
Network
Ip-address Mask
Network backdoor
Network ip-address mask backdoor
Enter the mask of the IP address in the slash prefix length
Format for example, /24
Permit bandwidth
Permit bandwidth
Redistribute
Parameters Connected Static Route-map map-name
Redistribute ospf
Match external
Process-id
Match internal
Error No router id configured
Router bgp
Router bgp as-number
Dellconf#router bgp Dellconf-routerbgp#
Set extcommunity bandwidth
Show capture bgp-pdu neighbor
Set extcommunity bandwidth
Show capture bgp-pdu neighbor ipv4-address
View the current Router BGP configuration
Show ip bgp
Ipv4 unicast
Network
Network-mask
Weight
Field Description Network
Next Hop
Metric
Show ip bgp cluster-list
Show ip bgp vrf vrf-name ipv4 multicast unicast ipv6
Command Modes Command History Usage Information Ipv4 unicast
Cluster-id
Show ip bgp community
Ipv4 multicast Ipv6 unicast Community- number
Local-AS No-advertise No-export
Dell#show ip bgp community ?
Show ip bgp community-list
Exact-match
424
Show ip bgp dampened-paths
Reuse
Show ip bgp detail
Syntax Defaults Command Modes Command History Example
Show ip bgp ipv4 unicast detail
428
Show ip bgp extcommunity-list
List name
Show ip bgp filter-list
Syntaxshow ip bgp vrf vrf-name ipv4 multicast unicast ipv6
As-path-name
Show ip bgp flap-statistics
Field Description
Ip-address
Is available
Destination network
000023 000000 200 32768 Dell#*n 66.66.77.77/32 0.0
Show ip bgp inconsistent-as
Show ip bgp vrf vrf-name ipv4 unicast inconsistent-as
Field Description Next Hop
Show ip bgp neighbors
Advertised
Dampened
Detail
Command Modes Flap-statistics Routes
Received updates
Lines Description Beginning with BGP neighbor
BGP version
BGP state
Last reset
Lines Description Beginning with Minimum time
List of inbound
Outbound
Show ip bgp next-hop
Capabilities advertised to neighbor for IPv4 Unicast
MULTIPROTOEXT1 ROUTEREFRESH2 ADDPATH69 CISCOROUTEREFRESH128
Show ip bgp vrf vrf-name next-hop
Show ip bgp paths
Total Displays the total number of BGP path attributes
Show ip bgp paths community
Address
Hash
Dell#show ip bgp paths ?
NO-ADVERTISE
Show ip bgp peer-group
2001 10001
Optional Enter the name of a peer group to view
Show ip bgp regexp
Show ip bgp vrf vrf-name regexp regular-expression
Regular
Character
Show ip bgp summary
Ipv6 unicast
Enabled
Field Description BGP router
Identifier BGP table version
Network entries
Show running-config bgp
Defaultsnone
Field Description Time Established Display Example Day
Week
Timers bgp
Mbgp Commands
OS Version 1.0, Mbgp for Series IPv4 Multicast Only
Distance bgp
External
Distance
Internal
Local-distance
457
458
CAM Profile Commands
Content Addressable Memory CAM
Important Points to Remember
Cam-acl Configuration
L2pt number
Command Modes
Cam-acl-egress
VersionDescription Usage Information
Cam-optimization qos
Cam-optimization
Qos Optimize CAM usage for QoS
Show cam-acl
Show cam-acl
Usage Information Example VersionDescription 70.0
L2PT
Test cam-usage service-policy input input policy name stack
Test cam-usage
L2Acl Block = 128 entries Ipv4Acl Ipv6Acl Ipv4Qos L2Qos
Policy-map
Term Explanation Stack-Unit
Portpipe
CAM Partition
Available CAM
Example S- Series Usage Information
Hardware forwarding-table mode
Unified Forwarding Table Modes
Scaled-l3
Hosts
Syntax Defaults Command Modes History
Show hardware forwarding-table mode
Show hardware forwarding-table mode
Service-policy rate-limit-cpu-queues
Syntaxservice-policy rate-limit-cpu-queues policy-name
Control Plane Policing CoPP
Control-plane-cpuqos
Service-policy rate-limit-protocols policy-name
Service-policy rate-limit-protocols
Policy-name
Show cpu-queue rate cp
Defaults Not configured Command Exec Privilege Modes
Show cpu-queue rate cp
Show ip protocol-queue-mapping
Show ip protocol-queue-mapping
TCP BGP
UDP Dhcp
UDP DHCP-R TCP FTP
Icmp
Show ipv6 protocol-queue-mapping
Show mac protocol-queue-mapping
DCB Command
Dcb-enable
Data Center Bridging DCB
Pfc-queues
PFC Commands
Clear pfc counters
Port-type
All stack-ports
Pfc no-drop queues
Pfc no-drop queues queue-range
Show dcb
Dot1p Value in the Description heading Incoming Frame
Unit-number
Port-set
Show interface pfc
Field Description Willing Status is
For an Ieee version
Error pkts
Example Summary FieldDescription
Input TLV pkts
Output TLV pkts
Show interface port-type slot/port pfc statistics
Show interface pfc statistics
Dell#show int te 1/1 pfc statistics
Clear ets counters
ETS Commands
Clear ets counters port-type slot/port
Parameters Defaults Command Modes Command History Port-type
Show interface ets
Show interface port-type slot/port ets summary detail
Port-type slot
Example Summary VersionDescription
ETS
TSA
Example Detail
Priority# Bandwidth TSA 13%
12%
2,3,4,5,6,7 100%
Dcbx Commands
Advertise dcbx-tlv
TLV
Pkts
Dcbx port-role
Reco pfc
Dcbx detail command
Ieee-v2.5 command
Dcbx version
Dcbx version auto cee cin ieee-v2.5
Defaults Ieee-v2.5
Debug dcbx
Fcoe priority-bits priority-bitmap
Fcoe priority-bits
Priority-bitmap
Iscsi priority-bits
Iscsi priority-bits priority-bitmap
Configuration
Show interface dcbx detail
Show interface port-type slot/port dcbx detail
Port-Role
Sync
ETS Configuration TLV enabled
ETS Configuration TLV disabled
ETS Recommendation TLV enabled
ETS Recommendation TLV disabled
Dcb-map map-name
Dcb-map
Alphanumeric characters is
Priority-pgid
DCB MAP
Group-num
Priority-group bandwidth pfc
Percentage
Dcb-map stack-unit all stack-ports all
Syntaxdcb-map stack-unit all stack-ports all dcb-map-name
Syntax Parameters Default Command Modes Command History
Dcb pfc-shared-buffer-size
Dcb-map Enter the name of the DCB map Name None
Dcb pfc-shared-buffer-size KB
Dcb buffer-threshold profile-name
Dcb-buffer-threshold
S4810-YU-MR-Dellconf#dcb buffer-threshold test
Priority
Qos-policy-buffer
Policy-name
Queue 0 to
Queue
Size
Dcb-policy buffer-threshold Interface Configuration
Dcb-policy buffer-threshold profile-name
Buffer
Profile-name
Show qos dcb buffer-threshold name
Show qos dcb-buffer-threshold
Dell#show qos dcb buffer-threshold
Stack-unit
Buffer-stats
Snapshot unit
Resource
# Type Total Buffered Cells
Ucast
Ucast Mcast
Instance 1 Instance 10S 20S
PG#
Instance Shared Hdrm Shared Hdrm in Cells
Resource all Unit 0 port 1 interface Fo 0/0 Stack-unit
Stack-unit Unit 0 port 5 interface Fo 0/4
… snip … Unit 0 port 104 interface Te 0/124 Stack-unit
# Type Total Buffered Cells Ucast
# Type Total Buffered Cells Mcast
PG# Shared Cells Headroom Cells
Dcb pfc-total-buffer-size
Dcb pfc-total-buffer-size KB
Syntax Command Modes Command History
Show running-config dcb-buffer-threshold
Show running-config buffer-threshold
519
Dcb pfc-queues
Default Command Modes Command History
Dcb pfc-queues value
Dcb ets pfc enable
Dcb ets pfc enable
ExampleDellconf#dcb pfc-queues
Debugging and Diagnostics
Diagnostics and Monitoring Commands
Logging coredump stack-unit
Syntaxlogging coredump stack-unit stack-unit-number all
Offline Diagnostic Commands
Diag stack-unit
Alllevels
Level0
Offline stack-unit
Level2
Verbose
Testname
Defaults None
Online stack-unit
Proceed with Offline-Diags confirm yes/noy
Online stack-unit number
Hardware Commands
Clear hardware stack-unit
Clear hardware system-flow
Unit number
Clear hardware vlan-counters
Port-set
Clear hardware vlan-couters vlan-id
Vlan-id
Hardware watchdog
Show hardware layer2
Parameters Eg-acl in-acl
Stack-unit id
Show hardware layer3 acl qos stack-unit number port-set
Show hardware layer3
Acl qos
Show hardware stack-unit
Option
Cpu
Statistics Cpu party-bus
Number no
Port-number
533
HOL Drops
Example Port- Stats Example Register
Invalid Vlan
535
Example Details
Show hardware stack-unit buffer
Example Total-Buffer
LinkStatus of Hg Port 27 is False
Example Buffer-Info Example Queue2/ Buffer-Info
Command Modes Command History Usage Information Example Port
Buffer-info
Show hardware system-flow
Parameters Acl qos Stack-unit id Port-set number counters
Grat ARP
OSPF1 Stub
OSPF2 Stub
Vrrp Stub
Show hardware vlan-counters vlan-id
Show hardware vlan-counters
Dell#show hardware vlan-counters
Show hardware stack-unit buffer-stats-snapshot
Dell#show hardware stack-unit 1 buffer-stats-snapshot unit
# Type Q# Total Buffered Cells Ucast Mcast
1000
Feature is disabled
Commands to Configure the System to be a Dhcp Server
Dynamic Host Configuration Protocol Dhcp
Clear ip dhcp
Debug ip dhcp server events packets
Debug ip dhcp server
Packet
Debug ipv6 dhcp
Default-router
Debug ipv6 dhcp
Disable
Syntaxdisable
Dns-server
Domain-name
Dns-server address address2...address8
Domain-name name
Low-address
Excluded-address
High-address
Hardware-address
Host
Hardware-address address
Address Enter the hardware address of the client
Lease
Lease days hours minutes infinite
Days
Hours
Netbios-name-server
Netbios-node-type
Netbios-node-type type
Enter the Netbios node type
Network network /prefix-length
Pool
Show ip dhcp binding
Pool name
Show ip dhcp binding
Show ip dhcp configuration
Show ip dhcp configuration global pool name
Pool name
Global
Show ip dhcp conflict
Show ip dhcp server
Show ip dhcp conflict address
Address Display a particular conflict log entry
Arp inspection
Commands to Configure Secure Dhcp
Arp inspection
Clear ip dhcp snooping
Arp inspection-trust
Arp inspection-trust
Defaults Command Modes Command History Example Interface
Clear ipv6 dhcp snooping binding
Ip dhcp relay
Remote-id
Trust
No ip dhcp snooping
Ip dhcp snooping
0.0 Introduced on the S4810 and S4820T
Ipv6 dhcp snooping
Ipv6 dhcp snooping vlan
No ipv6 dhcp snooping
No ip dhcp snooping vlan vlan-id
Mac address
Ip dhcp snooping binding
Ip ip-address
IPv6 Dhcp Snooping Binding
Vlan-id
Ipv6 ipv6
Lease value
Ipv6 dhcp snooping database write-delay
Ip dhcp snooping database write-delay minutes
Syntaxno ipv6 dhcp snooping database write-delay value
Ip dhcp snooping database
Ip dhcp snooping database renew
Ip dhcp snooping database renew
Ipv6 dhcp snooping database renew
Ip dhcp snooping trust
Ipv6 dhcp snooping database renew
No ip dhcp snooping trust
Ip dhcp source-address-validation
Ipv6 dhcp snooping trust
Ipmac
Syntaxip dhcp relay information-option trust-downstream vpn
Ip dhcp relay information-option
Vpn
Ip dhcp snooping verify mac-address
VersionDescription 0.0 Added support for VRF
Dellconf#ip dhcp relay information-option vpn
No ip dhcp snooping verify mac-address
Parameters Default Command Modes Command History
Ipv6 dhcp snooping verify mac-address
Ip helper-address
No ipv6 dhcp snooping verify mac-address
Show ip dhcp snooping
Ipv6 helper-address
VRF
Added the discard-counters , interface keywords,
576 Dynamic Host Configuration Protocol Dhcp
Show ipv6 dhcp snooping
Show ipv6 dhcp snooping
Commands to Configure DNS
Ip name-server
Ip domain-name
Information Example
Ip domain-list
Ip host
Ip domain-list vrf vrf-name name
Ip host vrf vrf-name name ip-address
Clear host
Dellconf#ip host vrf jay dell
Clear host vrf vrf-name * host-name
Host-name
Dell#clear host vrf jay dell
Ecmp-group
Equal Cost Multi-Path Ecmp
Ecmp-group ID
Hash-algorithm
Algorithm
585
Hg-seed seed- value stack- unit
Lag hash algorithm
Nh-ecmp checksum
Version Description 1.1
Dellconf#hash-algorithm linecard 5 ip-sa-mask ff ip-da
Ip ecmp weighted
Ip ecmp-group
Syntaxlink-bundle-distribution trigger-threshold percent
Link-bundle-distribution trigger-threshold
Percent
Link-bundle-monitor enable
Link-bundle-monitor enable
Flex Hash and Optimized Boot-Up
Load-balance ingress-port enable
Load-balance ingress-port enable
ExampleDell#load-balance ingress-port enable
Protocol
String
Offset1 value
Offset2 value
Reload-type fastboot
Reload-type fastboot
C9000 Series
Lacp fast-switchover
Lacp fast-switchover
Encapsulation dot1q vlan-id
Encapsulation dot1q
VersionDescription X.x Introduced on the C9000
FCoE Transit
Clear fip-snooping database interface vlan
Clear fip-snooping database interface vlan vlan-id enode
Enode-mac
Clear fip-snooping statistics
Port-type port
Slot
Port
Debug fip snooping
Debug fip snooping rx
Feature fip-snooping
Feature fip-snooping
Fip-snooping enable
Fip-snooping enable
Fip-snooping max-sessions-per-enodemac
Fip-snooping fc-map
Fip-snooping fc-map fc-map-value
Max-sessions
Fip-snooping port-mode fcf
Fip-snooping port-mode fcf
Show fip-snooping config
Show fip-snooping config
Fip-snooping port-mode fcoe-trusted
Fip-snooping port-mode fcoe-trusted
Show fip-snooping enode
Dell# show fip-snooping config
Show fip-snooping enode enode-mac-address
Show fip-snooping fcf
Field Description ENode MAC
ENode Interface
Vlan FC-ID
Show fip-snooping statistics
FCF Interface
No of ENodes
FCF MAC
Field Description Number of Vlan
Requests
Multicast
Discovery Solicits Number
Dell# show fip-snooping statistics interface vlan
Show fip-snooping system
Show fip-snooping system
Show fip-snooping vlan
Vlan FC-MAP
Show fips status
Show fips status
Clear frrp
Force10 Resilient Ring Protocol Frrp
Clear frrp ring-id
Command History Usage Information Example Related Commands
Debug frrp
Count number
Description
Description Word
Disable the resilient ring protocol
Interface
Control-vlan
Member-vlan vlan-range
Member-vlan
Vlan-range
Mode master transit
Mode
Master
Transit
Protocol frrp ring-id
Protocol frrp
Ring-id
Show frrp
Show frrp ring-idsummary summary
Timer
Syntaxtimer hello-interval milliseconds dead-interval
Milliseconds dead-intervalmilliseconds command
Garp Vlan Registration Gvrp
Clear gvrp statistics
Clear gvrp statistics interface interface
Debug gvrp config events pdu
Parameters Config
Debug gvrp
Pdu
Commands Protocol gvrp access Gvrp protocol
Garp timers
Parameters Defaults Command Modes Command History Join
Leave
Leave-all
Gvrp enable
Gvrp enable
Gvrp registration
Gvrp registration fixed normal forbidden
Fixed
Normal
Protocol gvrp
Protocol gvrp
Show config
Show garp timers
Syntax Command Modes Command History Related Commands
Show garp timers
Dell#show garp timers
Show gvrp
Show gvrp brief interface
Parameters Brief
Show gvrp statistics
Syntaxshow gvrp statistics interface interface summary
Enter the keyword summary to display just a summary
Join In Transmitted
Empty Transmitted
Leave In Transmitted
Leave Empty Transmitted
Icmp Message Types
637
Internet Group Management Protocol Igmp
Igmp Commands
Clear ip igmp groups
Series legacy command
Debug ip igmp
Group-address
Syntaxdebug ip igmp vrf vrf-name group address interface
VRF to enable debugging of Igmp packets corresponding
Ip igmp access-group
Ip igmp access-group access-list
Ip igmp immediate-leave
Syntaxip igmp immediate-leave group-list prefix-list-name
Group-list
Ip igmp last-member-query-interval
Syntaxip igmp last-member-query-interval milliseconds
20.0
Ip igmp query-interval
Ip igmp query-interval seconds
Ip igmp query-max-resp-time
Ip igmp query-max-resp-time seconds
Ip igmp vrf vrf-name ssm-map std-access-list source-address
Ip igmp ssm-map
Ip igmp version
Ip igmp version 2
Show ip igmp groups
Syntaxshow ip igmp vrf vrf-name groups group-address detail
Optional Enter the keyword detail to display
Igmp group
Include
Show ip igmp interface
Syntaxshow ip igmp vrf vrf-name interface interface
Usage Information Example Example VRF
Show ip igmp ssm-map
Show ip igmp vrf vrf-name ssm-map group
Group
Dell#show ip igmp ssm-map
Important Points to Remember for Igmp Snooping
Igmp Snooping Commands
Important Points to Remember for Igmp Querier
Clear ip igmp snooping groups
Debug ip igmp snooping
Clear ip igmp snooping groups group-address interface
Debug ip igmp snooping group address interface
Ip igmp snooping enable
Ip igmp snooping enable
Ip igmp snooping fast-leave
Ip igmp snooping fast-leave
Ip igmp snooping flood
Ip igmp snooping flood
Usage Information VersionDescription Series legacy command
Ip igmp snooping last-member-query-interval
Ip igmp snooping mrouter
Ip igmp snooping mrouter interface interface
Ip igmp snooping querier
Snooping querier command
Ip igmp snooping querier
Show ip igmp snooping groups
Show ip igmp snooping groups group-address detail detail
Show ip igmp snooping mrouter
Field Description Group Address
Member Ports
Show ip igmp snooping mrouter vlan number
Show ip igmp groups view groups
Basic Interface Commands
Interfaces
Clear counters
Clear counters interface vrrp ipv6 vrid learning-limit
Vrrp ipv6 vrid
Learning-limit
Clear dampening
Example Related Commands VersionDescription
Clear dampening interface
Dampening
Suppress
Max-suppress
Time
Description desctext
Desctext Enter a text string up to 240 characters long
Duplex 10/100 Interfaces
Duplex half full
Half
Flowcontrol
Full
Rx on
Rx off
Tx on
Tx off
672
Example Example Values
Enter one of the following keywords and slot/port or number
Interface
Range
675
Tengigabitethernet 1/1 5 interface group
Interface group
Tengigabitethernet 1/1-5
Interface loopback
Usage Information Example Related Commands
Interface loopback number
Example Related Commands Version
Interface ManagementEthernet
Dellconf#interface loopback 1655 Dellconf-if-lo-1655#
Interface ManagementEthernet slot/port
Interface null number
Interface null
Number Enter zero 0 as the Null interface number
Interface range
Dellconf#interface null Dellconf-if-nu-0#
Interface slot
Port, interface
Pre-Version Introduced on the E-Series 1.0
Example Bulk
Multiple Ports
Overlapping
Ports
Interface range macro define
Define interface range macro name interface , interface
Interface range macro name
Interface range macro name
Enter the name of an existing macro
Command Modes History Example Single Range Related Commands
Interface vlan
Interface vlan vlan-id of-instance of-id
Interface vlan vlan-id
Introduced on the S4810 added support for OpenFlow
Dellconf#int vlan Dellconf-if-vl-3#
Intf-type cr4 autoneg
Intf-type cr4 autoneg
Keepalive
Monitor interface
KeyDescription Systest-3
Key Description Monitor time
Time
Mtu
Example All Interfaces
692
Negotiation auto
Negotiation auto
Pre-6.2.1.0
Example Configured User Information
Portmode hybrid
No portmode hybrid command
Portmode hybrid
696
Example Vlan
Rate-interval
Rate-interval seconds
Dellconf-if-fo-1/4#show config
Interface fortyGigE 1/4
No ip address
Mtu
Show config from Interface Range mode
Show config for speed
No shutdown Dellconf-if-fo-1/4#
Show interfaces
Show interfaces interface
Added support for the tunnel interface type
Line Description TenGigabitEthern
Et 1/1
Hardware is
Pluggable media
Strategy
Line Description Queuing
Input Statistics
Example Usage Information Example 1G SFP LineDescription
Example Management Ethernet
Instance
Show interfaces configured
Show interfaces configured
Show interfaces dampening
Show interfaces dampening interface summary detail
Show interfaces stack-unit
Show interfaces stack-unit unit-number
710
Show interfaces status
Stack-unit slot
Syntaxshow interfaces vlan vlan-id Line description
Show interfaces vlan
Optional Enter the name of the Vlan
Show system stack-unit quad-port-profile
Syntax Parameters Command Modes Command History Example
Show system stack-unit-numberquad-port-profile
Stack-unit quad-port-profile
100 108 116 124 Dell#
Parameters Enter the port number. The range is from 0 to
Number 124
Show interfaces switchport
Show interfaces switchport interface stack-unit unit-id
802.1QTagged
Items Description Name
Vlan membership
Show interfaces transceiver
Tengigabitether
Net
FortyGigE
Line Description Rx Power
Type Temp High Alarm
Alarm threshold
Bias High Alarm
Line Description RX Power High
Power Low
Temperature
Tx Power
Tx Disable state
Temperature High
Alarm Flag
Temperature Low
Line Description Tx Bias Low
Dell#show interfaces TengigabitEthernet 1/1 transceiver
Show range
Show range
Shutdown
Dellconf-if-range-te-2/2,fo-2/56#show range
Dellconf-if-range-te-2/2,fo-2/56#
Shutdown
Speed 10 100 1000 auto
Speed Management interface
100
Stack-unit portmode
Stack-unit stack-unitport number portmode quad
Switchport
Backup
Tengigabit
Port-channel
Port Channel Commands
Interface command
Channel-member
Channel-member interface
Port or number information
Introduced on the S-Series Introduced on the C-Series
Group
Interface port-channel channel-number
Interface port-channel
Channel
Status. The range is from 1 to 16. The default is
Status. The range is from 1 to 8. The default is
Minimum-links
Minimum-links number
Port-channel failover-group
Port-channel failover-group
Usage Information Related Command VersionDescription 70.0
Show interfaces port-channel
Show interfaces port-channel channel-number brief
Channel
Series legacy command Usage
Field Description Port-Channel
Port-channel is
Part
Example User Information FieldDescription
Example Related Commands Field Description
Show port-channel-flow
Untitled
LAG
Command Modes Command History Usage Information Incoming
Source-ip
Destination-ip
Source-port
Enhanced Validation of Interface Ranges
Ip http source-interface
Ip ftp source interface
IPv4 Routing
Arp
Range is from 1 to 3600. The default is
Arp backoff-time
Arp backoff-time seconds
Enter the number of seconds an ARP entry is black-holed
Arp learn-enable
Arp learn-enable
Arp max-entries vrf vrf-name max-number
Arp max-entries
Max-number
Arp retries number
Arp retries
Enter the number of retries. The range is from 1 to 20.
Arp timeout
Arp timeout minutes
Clear arp-cache
Enter the number of minutes. The range is from 0 to
No-refresh
Clear host
Clear host name
Enter the name of the host to delete. Enter * to delete all
Host table entries
Clear ip fib stack-unit
Clear ip route
Clear ip fib stack-unit unit-numbervrf vrf-name
Syntaxclear ip route vrf vrf-name * ip-address mask
Format to clear that IP address from the routing table
Clear tcp statistics
Clear tcp statistics all cp rp1 rp2
Debug arp interface count value
Debug arp
Count value
Debug ip dhcp
Debug ip dhcp
Introduced on the C-Series Introduced on the E-Series
Debug ip icmp
Debug ip icmp interface count value
Debug ip packet
Access-group
Example Usage Information VersionDescription
Interface in parentheses through which the packet is
Being sent out on the network
Example Usage Information Field Description TCP src=
UDP src=
Icmp type=
IP Fragment
Ip address
Ip address ip-address mask secondary
Ip directed-broadcast
Directed-broadcast command
Ip directed-broadcast
Ip domain-list
Ip domain-list name
Ip domain-lookup
Ip domain-lookup
Ip domain-name
Ip domain-name name
Ip helper-address
Ip helper-address ip-address
Ip helper-address hop-count disable
Ip helper-address hop-count disable
Count disable command
Ip host name ip-address
Ip host
Ip address
Ip icmp source-interface
Ip icmp source-interface interface
Ipv6 icmp source-interface
Ipv6 icmp source-interface interface
Managementethernet
Dellconf#ipv6 icmp source-interface tengigabitethernet 1/1
Ip max-frag-count
Ip max-frag-count count
Ipv4-address2
Ip name-server
Ipv4-address6
Ip proxy-arp
Ip proxy-arp
Destination mask command
Ip route
Weight weight
Interface ip
Address Distance
Permanent
776 IPv4 Routing
Dellconf#do show running-config grep route ip route vrf
Test 1.1.1.0/24 4.4.4.2 weight 100 ip route vrf test
1.0/24 6.6.6.2 weight
Ip source-route
Ip tcp initial-time
Ip unknown-unicast
Ip tcp initial-time
Ip unknown-unicast vrf vrf-name
Ipv4 unicast-host-route
Show ip tcp initial-time
Ip unreachables
Show ip tcp initial-time
Ip unreachables
Load-balance
Enable
Tcp-udp enable
Ingress-port
Load-balance hg
Tunnel ipv4- over-ipv4 ipv4-over-gre- ipv4 mac-in- mac
Management route
FortyGigE vlan tengigabitethernet
Forwarding
Router-address
Managementet
Hernet
Show arp
Clear arp-cache command
Inspection
Macaddress
Retries
Clear arp in-progress. Please try after sometime
Lists which CPU the entries are stored on
Usage Information Example Summary Related Commands
Show arp retries
CPU
Show arp retries
Show hosts
Show hosts
Field Description Default domain
Name/address
Lookup
Name servers
Show ip cam stack-unit
Parameters Port-set pipe- number
Field Description Destination
Mac Addr
Show ip fib stack-unit
Example ECMP-Group Example Member-Info
EC C
VId Mac-Addr
Longer-prefixes
First-Hop
Mac-Addr
VId
Related Commands FieldDescription
Number tcp
Show ip flow
Src-port
Show ip interface
Syntaxshow ip interface interface brief configured
InterfaceOPTIONAL
Optional Enter the keyword brief to view a brief
States if Icmp unreachable messages are sent
Unreachables
Show ip management-route
Fields Description Method
Example Brief
Show ip management-route all connected summary static
Show ipv6 management-route
Show ip protocols
Show ip protocols
Show ip route
List prefix-list
Command Modes Command History Longer-prefixes
Routing-tag
Version Description 7.0
Field Description Undefined
Dist/Metric
Last Change
Example Example Summary Example vrf
Example With Weighted Ecmp Enabled
Ecmp
Show ip route list
Show ip route vrf vrf-namelist prefix-list
N2- Ospf
E2- Ospf
Show ip route summary
Show ip route vrf vrf-name summary
Column Heading Description Route Source
Active Routes
Example Related Commands Column Heading Description Ospf
Show ip traffic
Active
Show ip traffic all cp rp1 rp2
Keyword Definition Unknown
Not a gateway
Security failures
Bad options
Dell Networking OS repeats the request three times. These
Packets are counted in encapsulation failed
Dell#show ip traffic
Control Processor IP Traffic
Show tcp statistics
Show tcp statistics all cp rp1 rp2
Field Description Rcvd
Checksum
17 dup
Partially
Initiated
Number of packet delayed
Closed Total rxmt
IPv6 Basics
Cam-ipv6 extended-prefix
Cam-ipv6 extended-prefix Max-IPv6-prefixes
Max-IPv6
Clear ipv6 route
Clear ipv6 route vrf vrf-name * ipv6-address prefix- length
Maximum dynamic-routes-ipv6
Limit
Ipv6 unicast-host-route
Show cam-ipv6 extended-prefix
Version Description 70.0 Introduced on the S6000-ON 30.1
Ipv6-RDNSS
Ipv6 nd dns-server
Lifetime
Ipv6 route
Dellconf-if-te-1/1#ipv6 nd dns-server 10001
To support weighted Ecmp feature. Introduced on
Tag value
Show ipv6 route views the IPv6 configured routes
Show ipv6 route
Added support for VRF. Introduced on S6000-ON
BGP,LO
RIP
Nssa
829
Show cam-acl-egress
IPv6 Access Control Lists IPv6 ACLs
Show cam-acl-egress
Show cam-acl
+F394
Parameters Defaults
Example Manual Profiles Related Commands
Permit icmp
Permit
Syntaxpermit ipv6-protocol-number icmp ipv6 tcp udp
Ipv6 control-plane egress-filter
Ipv6 access-list
Ipv6 control-plane egress-filter
Ospfv3
Cam-acl-egress default l2acl 1-4ipv4acl 1-4ipv6acl
Cam-acl-egress
L2acl
Ipv4acl 1
Ipv4acl
Cam-acl default l2acl 1-10ipv4acl 1-10ipv6acl 0-10ipv4qos
L2qos
839
Adjacency-check
Intermediate System to Intermediate System IS-IS
Adjacency-check
Parameters Level1-into
Advertise
Level2-into
Area-password
Area-password hmac-md5 encryption-type password
Type Password
Parameters Hmac-md5
Clear config
Clear config
Clear isis
Clear isis vrf vrf-name tag * database traffic
Tag
Database
Clns host name nsap
Clns host
Nsap
Debug isis adj-packets
Debug isis
Debug isis
Debug isis local-updates
Syntaxdebug isis vrf vrf-name local-updates interface
Packets tied to that VRF. The command displays the SNP
Debug isis snp-packets
Syntaxdebug isis vrf vrf-name snp-packets interface
CSNP/PSNP related debugging information
Debug isis spf-triggers
Triggers command
Debug isis vrf vrf-name spf-triggers
Debug isis update-packets
Debug isis vrf vrf-name update-packets interface
Always
Default-information originate
Metric metric
Enter a description of the IS-IS routing protocol
Distance
Enter a description to identify the IS-IS protocol
Distribute-list
Name Interface
Command Modes Command History Related Commands
Distribute-list out
Ospf process-id
Bgp as number
Distribute-list redistributed-override
Distribute-list redistributed-override
Domain-password hmac-md5 encryption-type password
Domain-password
Do not specify an encryption type or hmac-md5
Graceful-restart ietf
Graceful-restart ietf
Ietf
Graceful-restart interval
Graceful-restart interval minutes
Graceful-restart t1
Graceful-restart restart-wait
Graceful-restart restart-wait seconds
Graceful-restart t2
Retry-times
Graceful-restart t2 level-1 level-2 seconds
Parameters Level-1, level-2
Graceful-restart t3
Graceful-restart t3 adjacency manual seconds
Adjacency
Manual
To-point command
Hello padding
Hello padding multi-point point-to-point
Point-to-point
Hostname dynamic
Hostname dynamic
Ignore-lsp-errors
Ignore-lsp-errors
Ip router isis
Ip router isis tag
Ipv6 router isis
Ipv6 router isis tag
Isis circuit-type
Syntaxisis circuit-type level-1 level-1-2 level-2-only
Isis csnp-interval
Level-1 level-2 command
Isis csnp-interval seconds level-1 level-2
Isis hello-interval
Isis hello-interval seconds level-1 level-2
Syntaxisis hello-multiplier multiplier level-1 level-2
Isis hello-multiplier
Multiplier
Isis hello padding
Isis hello padding
Default-metric
Syntaxisis ipv6 metric default-metriclevel-1 level-2
Isis ipv6 metric
Isis metric default-metric level-1 level-2
Configured on level-1-2, or it will be capped
Isis metric
Greater than 63, metric-style wide should be
Isis network point-to-point
Isis network point-to-point
Isis password
Syntaxisis password hmac-md5 password level-1 level-2
Isis priority
Isis priority value level-1 level-2
Is-type
Is-type level-1 level-1-2 level-2-only
Log-adjacency-changes
Lsp-gen-interval
Log-adjacency-changes
Level-l
Interval
Initialwaitinte
Rval seconds
Secondwaiti
Lsp-mtu
Lsp-mtu size
Lsp-refresh-interval
Lsp-refresh-interval seconds
Max-area-addresses
Max-lsp-lifetime
Max-area-addresses number
Max-lsp-lifetime seconds
Maximum-paths
Maximum-paths number
Metric-style
Parameters Narrow
Transition
Wide
Transition command
Parameters Transition Defaults
Multi-topology
Multi-topology transition
Net
Entity-title
Passive-interface
Passive-interface interface
Parameters Defaults Command Modes Connected
Redistribute
Metric-type
Internal
889
Redistribute bgp
AS number
Redistribute ospf
Range is from 0 to 16777215. The default is
Be redistributed. The range is from 1 to
Defaults Command Modes Command History Metric-type
Version Description 1.0 Introduced Usage
Router isis
Router isis vrf vrf-name tag
Set-overload-bit
Set-overload-bit
Example Router-Isis VersionDescription 70.0
Show isis database
Example Address- FamilyIPv6
Spf-interval level-2 120 20 25 exit-address-family
Lspid
Field Description IS-IS Level-1
Level-2 Link State Database
LSP Seq Num
LSP Checksum
Lspid LSP
Seq Num LSP Checksum
Is OSPF.00
Metric Is MT-IPv6 OSPF.00
Syntax Command Modes Parameters Command History
Show isis graceful-restart detail
Lspid
ATT/P/OL
Show isis vrf vrf-name hostname
Show isis hostname
Enter the keyword vrf followed by the name of the VRF to
Show isis interface
Show isis vrf vrf-name interface interface
Show isis neighbors
Command Modes Command History Usage Information Level-2
Show isis protocol
Field Description Type
Circuit Id
Show isis vrf vrf-name protocol
Show isis traffic
Multi Topology Routing is enabled in transition mode
Show isis vrf vrf-name traffic interface
ItemDescription
Hellos sent/rcvd
LSPs flooded sent/rcvd
LSPs CSNPs sent/ rcvd
Displays the number of LSP authentication failures
Authentication Failures Example
Spf-interval
Level-1/Level-2
Enter the maximum number of seconds between SPF
909
Link Aggregation Control Protocol Lacp
Clear lacp counters
Debug lacp
Syntaxdebug lacp config events pdu interface-typein out
Interface-type
Lacp long-timeout
Lacp long-timeout
Timeout command
Lacp port-priority
Lacp port-priority priority-value
Lacp system-priority
Lacp system-priority priority-value
Port-channel-protocol lacp
Show lacp
Port-channel-protocol lacp
Syntaxshow lacp port-channel-numbersys-id counters
Outofsync
Example Counter Related Commands
Dell# Dell#show lacp 1 counters Port
Lacp PDU
Marker PDU Unknown Illegal Xmit Recv Pkts Rx 200 Dell#
MAC Addressing Commands
Layer
Mac-address-table aging-time
Mac-address-table aging-time seconds
Mac-address-table static
Multicast
Output-range
Mac-address-table station-move refresh-arp
Mac learning-limit
No mac-address-table station-move refresh-arp
Addresslimit
Violation
Syntaxmac learning-limit learn-limit-violation log shutdown
Mac learning-limit learn-limit-violation
Shutdown
Mac learning-limit mac-address-sticky
Mac learning-limit mac-address-sticky
Parameters Defaults Command Modes Command History Log
Mac learning-limit station-move-violation
Shutdown-both
Offending
Mac learning-limit reset
Mac learning-limit reset
Show mac-address-table
Version Description 1.0 Introduced on the E-Series Usage
Address/ mac-address , interface/ interface , or vlan
Parameters Command Modes Command History Address mac
Aging-time
Column Heading Description VlanId
Mac Address
Usage Information Example Count Related Commands
Line Beginning Description With MAC Entries
Address Static Address
Total MAC
Show mac learning-limit
Show mac-address-table aging-time
Show mac-address-table aging-time vlan vlan-id
Optional Enter the keywords violate-action to
Virtual LAN Vlan Commands
Default vlan-id
Default vlan-id vlan-id
Slot/port Limit MAC count Drops Te 1/1
Description description
Interface Vlan
Name
Default-vlan disable
Vlan-name Enter up to 32 characters as the name of the Vlan
Display the current configuration of the selected Vlan
Dellconf-if-vl-100#show config
Updated to support OpenFlow
Show vlan
Id vlan-id
Column Heading Description Column 1 no
Heading
NUM
Example Example Vlan ID Column Heading Description
Status Description Q Ports Active Te 13/47
Tagged
Status Description Ports Inactive Te 1/10
All interfaces in Layer 2 mode are untagged
Track ip
Track ip interface
Untagged
Untagged interface
Debug fefd
Far-End Failure Detection Fefd
Debug fefd events packets interface
Syntaxfefd disableintervalmode aggressivenormal
Legacy E-Series command
Fefd
Fefd disable
Fefd disable
Fefd interval
Fefd interval seconds
Fefd mode normal aggressive
Fefd mode
Aggressive
Fefd reset
Legacy E-Series command Related
Fefd reset interface
Optional Enter the following keywords and slot/port or
Fefd-global interval
Fefd-global
Fefd-global interval seconds
Syntaxfefd-global interval secondsmode normal aggressive
Enter the keyword interval followed by the number
Show fefd
Show fefd interface
Example Related Commands FieldDescription
Interface Mode Interval State
Link Layer Discovery Protocol Lldp
Llpd Commands
Advertise dot1-tlv
Vlan-name
Advertise dot3-tlv
Advertise dot3-tlv max-frame-size
Clear lldp counters
Clear lldp counters interface
Clear lldp neighbors
Clear lldp neighbors interface
Allevents packet brief detail tx rx both command
Debug lldp interface
Enable or disable Lldp
Hello
Mode tx rx
Mode
Multiplier
Multiplier integer
Integer
Protocol lldp Configuration
Protocol lldp
Protocol lldp Interface
No protocol lldp
Show lldp neighbors
Show lldp neighbors interface detail
R1conf-if-te-1/31#do show lldp neighbors
Show lldp statistics
Show lldp statistics
LLDP-MED Commands
Advertise med guest-voice
Layer2priority
DSCPvalue
Advertise med guest-voice-signaling vlan-id layer2priority
Advertise med guest-voice-signaling
DSCPvalue priority-tagged number
Advertise med location-identification
Coordinate
Based value
Civic-based
Advertise med power-via-mdi
Advertise med power-via-mdi
Advertise med softphone-voice
Advertise med streaming-video
Advertise med video-conferencing
Advertise med video-signaling
Advertise med voice
Advertise med voice-signaling
975
Table static command
Microsoft Network Load Balancing
Arp for Multicast MAC Address
Multicast-mac
Mac-address-table static for Multicast MAC Address
Ip vlan-flooding
Defaults Command Modes Command History Example Multicast
Ip vlan-flooding
Multicast Source Discovery Protocol Msdp
Clear ip msdp peer
Clear ip msdp peer peer address
Peer address
Clear ip msdp sa-cache
Rejected-sa
Clear ip msdp statistic
Ip msdp cache-rejected-sa
Clear ip msdp statistic peer peer-address
Peer-address
Ip msdp default-peer
Ip msdp default-peer peer address list name
Peer address
List name
Ip msdp log-adjacency-changes
Ip msdp log-adjacency-changes
Ip msdp mesh-group
Ip msdp mesh-group name peer address
Ip msdp originator-id
Ip msdp originator-id interface
Connect
Ip msdp peer
Sa-limit
Ip msdp redistribute
Defaults Not configured
Ip msdp redistribute list acl-name
Ip msdp sa-filter in out name command
Syntaxip msdp sa-filter in out peer-addresslist access-list
Ip msdp sa-filter
Ip msdp sa-limit
Ip msdp sa-limit number
Ip msdp shutdown
Ip msdp shutdown peer address
Ip multicast-msdp
Ip multicast-msdp
Peer peer
Show ip msdp
Sa-cache
Example Sa
Show ip msdp sa-cache rejected-sa
Cache
994
Debug spanning-tree mstp
Multiple Spanning Tree Protocol Mstp
Parameters All Bpdu Interface in out Events
Multiple Spanning Tree
Forward-delay
Forward-delay seconds
Hello-time
Hello-time seconds
Max-age seconds
Max-age
Max-age
Msti
Msti instance
Vlan range
Bridge-priority
Name
Name region-name
Protocol spanning-tree mstp
Tree mstp command
Protocol spanning-tree mstp
Revision
Enter the revision number for the MST configuration.
Revision range
Dellconf-mstp#show config
No disable Name CustomerSvc revision Msti 10 Vlan
Show spanning-tree mst configuration
Dell#show spanning-tree mst configuration
MST region name CustomerSvc
Msti VID
Show spanning-tree msti
Show spanning-tree msti instance-numberbrief guard
Instance
Guard
Example EDS and LBK
P2P
Spanning-tree
Usage Information Example Guard
Field Description Interface Name
Sts
Spanning-tree msti
Cost cost
Tc-flush-standard
DefaultsDisabled
Syntaxtc-flush-standard
1011
Multicast
IPv4 Multicast Commands
Clear ip mroute
Ip mroute
Isis rip static ip-address tag null 0 distance command
Null
Ip multicast-limit
Static ip- address
Ip-address Distance
Ip multicast-limit vrf vrf-name limit
Ip multicast-routing
Ip multicast-limit command is reached
Ip multicast-routing vrf vrf-name
Show ip mroute
Group-address source- address
Summary Vlt
1018 Multicast
Show ip rpf
Outgoing
Interface list
Show ip rpf
1020 Multicast
Neighbor Discovery Protocol NDP
IPv6 Router Advertisement RA Guard
Clear ipv6 neighbors
Clear ipv6 neighbors vrf vrf-name ipv6-address interface
Defaults Command Modes History
Debug ipv6 nd ra-guard
Device-role
Interfacetype
Parameters Defaults Command Modes History
Hop-limit
Router
Hop-limit maximum minimum limit
Ipv6 nd ra-guard enable
Ipv6 nd ra-guard attach-policy
Parameters Policy policy
Vlan vlan
Defaults Command Modes History Related Commands
Ipv6 nd ra-guard policy
Ipv6 neighbor
Ipv6 nd ra-guard policy policy-name
Hardwareaddr
Neighbor vrf vrf-name ipv6-address interface interface
Ess
Managed-config-flag
Managed-config-flag on off
Match ra
Off
Ipv6-prefix-list
Access-list
Ipv6-mac
Defaults Command Modes History Related Commands Ipv6-mac
Other-config-flag
Other-config-flag on off
Parameters Defaults Command Modes History Related Commands
Reachable-time
Retrans-timer value
Retrans-time
Router-lifetime
Router-preference maximum
Router-lifetime value
High
Defaults Command Modes History Medium
Trusted-port Dellconf-raguardpolicylist#
Show ipv6 nd ra-guard policy
Show ipv6 nd ra-guard policy policy-name
Show ipv6 neighbors
Trusted-port Interfaces Te 1/1 Dell#
Delay
Vlan CPU
Stale
Reach
Trusted-port
Syntaxtrusted-port
IPv4 Object Tracking Commands
Object Tracking
Debug track
Object-id
Delay
Delay up seconds down seconds
Description text
Show running-config track
Show running-config track object-id
Resolution
Show track
Ip route
OutputDescription
Up/Down state of tracked object for example, IPv4
Address Object is Up
Hoursminutesseconds
Threshold metric
VLAN100
Threshold metric up number down number
Up number
Track interface ip routing
Track object-idinterface interface ip routing
Track interface line-protocol
Syntaxtrack object-idinterface interface line-protocol
Track ip route metric threshold
Prefix-len
Track ip route reachability
Enter an IPv4 address in dotted decimal format. The valid
Isis resolution
Track resolution ip route
Resolution
Show track ipv6 route
IPv6 Object Tracking Commands
Show track ipv6 route brief
Track object-id
Ip-address , IPv6
Dell#show track ipv6 route brief
ResId Resource Parameter State LastChange
Track interface ipv6 routing
Syntaxtrack object-idinterface interface ipv6 routing
Track ipv6 route metric threshold
Threshold
Track ipv6 route reachability
Track resolution ipv6 route
Track resolution ipv6 route isis resolution-value ospf
Enter the ID number of the tracked object. Use the range to
Table for Isis routes to a scaled metric
1058 Object Tracking
OSPFv2 Commands
Area default-cost
Open Shortest Path First OSPFv2 and OSPFv3
Area-id
Area nssa
Pre
Redistribution
Originate
Area area-id range ip-address mask not-advertise
Area range
Not-advertise
Area area-id stub no-summary
Area stub
No-summary
Auto-cost reference-bandwidth ref-bw
Auto-cost
Ref-bw
Clear ip ospf
Clear ip ospf process-idvrf vrf-name process
Clear ip ospf process-id vrf vrf-name statistics interface
Clear ip ospf statistics
Router-id
Bfd
Debug ip ospf
Spf
Added the database-timer rate-limit option for the S4810
Field Description 814
Field Description Rid
Aid
Chk
Aut
Parameters Defaults Command Modes Command History Always
Default-information originate
Type-value
Version Description 19.0
Add a description about the selected Ospf configuration
Syntaxdistance weight ip-address mask access-list-name
Distance
Distance ospf
Distance ospf external dist3 inter-area dist2 intra-area
Redistribute command
Parameters Enter the name of a configured prefix list
Distribute-list
Optional Enter one of the following keywords and slot
Distribute-list out
Fast-convergence
Fast-convergence number
Flood-2328
Flood-2328
Graceful-restart grace-period
Graceful-restart grace-period seconds
Graceful-restart helper-reject
Graceful-restart helper-reject ip-address
Graceful-restart mode
Graceful-restart mode planned-only unplanned-only
Planned-only
Unplanned
Graceful-restart role
Graceful-restart role helper-only restart-only
Parameters Role helper
Role restart
Ip ospf authentication-key
Syntaxip ospf authentication-key encryption-type key
Ip ospf auth-change-wait-time
Ip ospf auth-change-wait-time seconds
To return to default value, use the no ip ospf cost command
Ip ospf cost
Type Key
Ip ospf cost cost
Ip ospf dead-interval
Ip ospf dead-interval seconds
Ip ospf hello-interval
Ip ospf hello-interval seconds
Ip ospf message-digest-key keyid md5 key
Ip ospf message-digest-key
Keyid
Ip ospf mtu-ignore
Ip ospf mtu-ignore
Ip ospf network broadcast point-to-point
Ip ospf network
Broadcast
Ip ospf priority
Ip ospf priority number
Ip ospf retransmit-interval
Ip ospf retransmit-interval seconds
Ip ospf transmit-delay
Ip ospf transmit-delay seconds
Log-adjacency-changes
Syntaxlog-adjacency-changes
Enable the software to forward packets over multiple paths
Mib-binding
Introduced support for OSPFv3 on the S4810 and Z9000
Mib-binding
Information MIB manager, the first Ospf process is used
Network area
Passive-interface default interface
Passive-interface
Passive-interface default
No passive-interface interface
Enter the keyword connected to specify that information
Redistribute bgp
Enter the autonomous system number. The range is from
Redistribute isis
Tag tag-value
Router-id ip-address
Router-id
Ip-address Enter the router ID in the IP address format
Router ospf
Router ospf process-idvrf vrf name
Vrf name
Added support for OSPFv3 on the S4810 and Z9000
Dellconf#router ospf Dellconf-routerospf#
Dellconf-routerospf#show config
Process ID is entered, command applies only to the first
Show ip ospf
Version Description Pre Introduced on the E-Series Example
Line Beginning Description With Routing
Show ip ospf asbr
Show ip ospf process-id vrf vrf-name asbr
Show ip ospf database
Field Description Link ID
ADV Router
Age
Seq#
Show ip ospf database asbr-summary
172.16.1.0 13.1.1.1 148 0x8000006d 0x533b Dell
Show ip ospf process-id vrf vrf-name database asbr-summary
Link-state-id
Field Description LS Age
LS Type
Link State ID
Advertising Router
Show ip ospf database external
Show ip ospf process-id vrf vrf-name database external
Pre-6.1.1.1
LS Seq Number
Example Related Commands Field Description Network Mask
Metrics Type
Forward Address
External Route
Show ip ospf database network
Show ip ospf process-id vrf vrf-name database network
Attached Router
Options TOS-capability, No DC, E
Show ip ospf database nssa-external
Show ip ospf process-id vrf vrf-name database nssa-external
Show ip ospf database opaque-area
1118
Example Related Commands Description Advertising Router
Show ip ospf database opaque-as
Opaque Type
Opaque ID
Show ip ospf database opaque-link
Parameters Command Modes Command History Related Commands
Show ip ospf database router
Show ip ospf process-id vrf vrf-name database router link
Number of Links
Link connected
Link Data
Number of TOS
Show ip ospf database summary
View LSA routing information corresponding to the Ospf
Dell#show ip ospf 100 database summary
Summary Network Area
LS type Summary Network
Checksum 0xb5a2
Show ip ospf interface
TOS
Transmit Delay
Timer intervals
GigabitEthernet
Designated
Show ip ospf neighbor
Dead
FULL/DR
000032 Te 1/1 0.2 192.10.10.2
000037 Te 1/2 0.1
20.20.20.1 1 FULL/DROTHER000036 192.10.10.4 Te 1/3 Dell#
Show ip ospf routes
Show ip ospf process-id vrf vrf-name routes
Show ip ospf statistics
1133
Error Type Description IntfDown
Auth-Error
MD5-Error
Conf-Issue
Error Type Description Seq-no
Example Usage Information
Socket
Overflow
Show ip ospf timers rate-limit
Show ip ospf process-id vrf vrf-name timers rate-limit
Version Description 8.0 Introduced on the S4810 Example
Show ip ospf topology
Show ip ospf process-id vrf vrf-name topology
Summary-address
Timers spf
Delay
Timers throttle lsa all
Start-interval
Hold-interval
Max-interval
Timers throttle lsa arrival arrival-time
Timers throttle lsa arrival
Arrival-time
OSPFv3 Commands
Area authentication
Area area-id
Ipsec spi number
Introduced on the S4810 and Z9000
Area encryption
Defaults Command Modes Key Null
Clear ipv6 ospf process
Debug ipv6 ospf bfd
Clear ipv6 Ospf vrf vrf-name process
No debug ipv6 ospf bfd interface
OSPFv3INFO Received Interface mode bfd config
Command on interface Te 1/2 Enable 1, interval 0, minrx
Multiplier 0, role 0, Disable
Dellconf-if-te-1/2#do debug ipv6 ospf bfd te 1/2
Debug ipv6 ospf packet
Debug ipv6 ospf packet events interface
Lines Beginning Description With or Including OSPFv3
Router ID
Area ID
Chksum
Period
Parameters Planned-only
Ipv6 ospf area
Ipv6 ospf process id areaarea id
Ipv6 ospf authentication
Ipv6 ospf authentication null ipsec spi number MD5 SHA1
Parameters Null
Ipsec spi number
Ipv6 ospf cost
Interface-cost
Ipv6 ospf dead-interval
Ipv6 ospf dead-interval seconds
Key- encryption- type Authentication- algorithm
Ipv6 ospf encryption
1157
Ipv6 ospf graceful-restart helper-reject
Ipv6 ospf hello-interval
Ipv6 ospf graceful-restart helper-reject
Helper-reject
Ipv6 ospf priority
Ipv6 ospf priority number
Ipv6 router ospf process-idvrf vrf-name
Ipv6 router ospf
Process-id Vrf vrf-name
Max-metric router-lsa
Series, E-Series, Z-Series, S4810
Wait-time
Interface interface command
Defaults Command Modes History Usage Information
1165
Ip-address Enter the router ID in the dotted decimal format
Name name
Show crypto ipsec policy
Policy
Show crypto ipsec policy Command Fields
Show crypto ipsec sa ipv6
Show crypto ipsec sa ipv6 interface interface
Dell#show crypto ipsec policy
Dell#show crypto ipsec sa ipv6
Interface TenGigabitEthernet 1/1
Status Active
Show ipv6 ospf database
Process
Number Vrf vrf-name
Database- summary Grace-lsa
1172
000037 Te 1/4 63.114.8.36
Show ipv6 ospf interface
Number Vrf vrf-name Interface
Show ipv6 ospf neighbor
Syntaxshow ipv6 ospf process-number vrf vrf-name neighbor
Process- number Vrf vrf-name Interface
000038 63.114.8.36 Dell#
Policy-based Routing PBR
Ip redirect-group
Ip redirect-group redirect-list-name
Ip redirect-list
Redirect-list
Protocol-type
Redirect
Tunnel
Tunnel-id
Track
Optional For TCP and UDP parameters only. Enter one
Command Version Description History 70.0
Seq
Source port
Source-port
Show cam pbr
Port-range
Enter the name of a configured Redirect list
Show ip redirect-list
Show ip redirect-list redirect-list-name
Modes Exec Privilege
1186 Policy-based Routing PBR
PIM-Sparse Mode PIM-SM
IPv4 PIM-Sparse Mode Commands
Clear ip pim rp-mapping
Clear ip pim vrf vrf-name rp-mapping rp-address
Clear ip pim vrf vrf-name tib group
Clear ip pim tib
Group
Debug ip pim
Bsr
Packet in out
Register
Ip pim bsr-border
Ip pim bsr-border
Ip pim bsr-candidate
Clear ip pim rp-mapping command
Hash-mask
Ip pim dr-priority
Ip pim dr-priority priority-value
Ext-access-list
Syntaxip pim vrf vrf-name join-filter ext-access-list
Ip pim join-filter
Ip pim neighbor-filter
Version Description 50.0
Ip pim query-interval
Ip pim query-interval seconds
Syntaxip pim vrf vrf-name register-filter access-list
Ip pim register-filter
Command before creating the access-list
Ip pim rp-address
Ip pim vrf vrf-name rp-address address group-address group
Group-address
Ip pim rp-candidate
Syntaxip pim vrf vrf-name rp-candidate interface priority
Ip pim sparse-mode
Ip pim sparse-mode
Ip pim sparse-mode sg-expiry-timer
Ip pim vrf vrf-name sparse-mode sg-expiry-timer seconds
Accesslistna
Ip pim vrf vrf-name ssm-range accesslistname
Ip pim ssm-range
Introduced on the S6000-ON. Added support for VRF on
Show ip pim bsr-router
Ip pim spt-threshold
Infinity
Show ip pim interface
Parameters Command Modes Command History Example
Show ip pim vrf vrf-name interface
Field Description Address
Ver/Mode
Nbr Count
Query Intvl
Show ip pim neighbor
Show ip pim vrf vrf-name neighbor
Show ip pim rp
Field Description Neighbor address
Uptime/expires
Ver
Command Modes Command History Example Example Mapping
Show ip pim ssm-range
Show ip pim summary
Exmaple
Group Address / MaskLen
PIM-SNOOPING
Show ip pim tib
Source-address
RPF neighbor
1213
Command Parameters Description
Port Monitoring
Monitor session
Session-ID
Rpm
Erpm
Ttlvalue
Set ip ttl
Dscp TTL
Session
Dellconf-mon-sess-1#show config
Monitor
Show monitor session
Parameters Defaults Command Modes Command History Example
Show monitor session session-ID
Show running-config monitor session
Syntaxshow running-config monitor session session-ID
Source port monitoring
Interface direction rx tx both command
Parameters Source
Enter the keyword direction then one of the packet
Private Vlan Pvlan
Private Vlan Concepts
Ip local-proxy-arp
No ip local-proxy-arp
Syntaxno private-vlan mode community isolated primary
Private-vlan mode
Isolated
Syntaxno private-vlan mapping secondary-vlan vlan-list
Private-vlan mapping secondary-vlan
Vlan-list
Parameters Host
Switchport mode private-vlan
Promiscuous
Enter the keyword trunk to configure the selected port or
Per-VLAN Spanning Tree Plus PVST+
Protocol spanning-tree pvst enter PVST+ mode
Extend system-id
Extend system-id
Dellconf-pvst#do show spanning-tree pvst vlan 5 brief
Vlan
Protocol spanning-tree pvst
Protocol spanning-tree pvst
Show spanning-tree pvst
Show spanning-tree pvst vlan vlan-id brief guard
Usage Information Example Brief VersionDescription
Example Example EDS/ LBK
TenGigabitEthernet 1/1 of Vlan 2 is Lbkinc discarding
Example EDS/ Pvid Example Guard Related Commands
Spanning-tree pvst
TenGigabitEthernet 1/1 of Vlan 2 is Pvidinc discarding
Loopguard Te 1/3/1 EDSShut Bpduguard
Cost number
1237
Spanning-tree pvst err-disable
Spanning-tree pvst err-disable cause invalid-pvst-bpdu
Dellconf-if-te-1/1#spanning-tree pvst vlan 3 cost
Dellconf-if-te-1/1#end
Tc-flush-standard
Vlan bridge-priority
Vlan vlan-rangebridge-priority value
Vlan forward-delay
Vlan vlan-rangeforward-delay seconds
Vlan hello-time
Hello-time
Vlan max-age
Max-age
1244
Quality of Service QoS
Global Configuration Commands
Qos-rate-adjust
Qos-rate-adjustment overhead-bytes
Service-class bandwidth-percentage
Show qos dot1p-queue-mapping
Service-class dot1p-mapping
Parameters Queue
Strict-priority queue
Strict-priority queue unicast number
Per-Port QoS Commands
Dot1p-priority
Dot1p-priority priority-value
Dot1p Queue Number
Rate police
Parameters Kbps
Committed
Rate Burst-KB
Rate shape kbps rate burst-KB
Rate shape
Rate
Service-class dynamic dot1p
Service-class dynamic dot1p
Policy-Based QoS Commands
Buffer-stats-snapshot
Bandwidth-percentage
Bandwidth-percentage percentage
No buffer-stats-snapshot
Class-map
Match-all
Class-map
Layer2
Clear qos statistics
Clear qos statistics interface-name
Pre- 7.7.1.0 Introduced Related Commands
Match ip access-group
Access-group
Set-ip-dscp
Set-color value
Match ip dscp
Syntaxmatch ip ipv6 ip-any dscp dscp-listset-ip-dscp value
Ip-any
Dscp-list
Match ip dscp and match ip precedence commands are mutually
2,3,4,5,6,7 or match ip dscp 0-7 command
Match ip precedence
Precedence-list
Usage Information Related Commands Version Description 70.0
Match mac access-group
Match mac access-group mac-acl-name
Match mac dot1p dot1p-list
Match mac dot1p
Dot1p-list Enter a dot1p value. The range is from 0 to
Match mac vlan
Policy-aggregate
Number Enter the Vlan ID. The range is from 1 to
Qos-policy
Name cpu-qos layer2 command
Policy-map-input
Policy-map-input policy-map-name cpu-qos layer2
Cpu-qos
Policy-map-output
Policy-map-output policy-map-name
Qos-policy-input
Qos-policy-input qos-policy-namecpu-qos layer2
Qos-policy-output
Qos-policy-output qos-policy-name
Rate-police
Rate-police kbps committed-rate burst-KB peak kbps peak
Rate-shape
Rate-shape kbps rate burst-KB
Service-policy input
Service-policy input policy-map-name layer2
Service-policy input policy-map-name command
Service-policy output
Service-policy output policy-map-name
Service-queue
Queue-id
Class-map
Input only
Set
Show qos class-map
Parameters Ip-dscp value
Mac-dot1p
Show qos policy-map
Syntaxshow qos policy-map summary interface detail
Defaults Command Modes History Example IPv4 Example IPv6
CM1 CM2 CM3 CM4 CM5 CM6 CM7
Show qos policy-map-input
Summary IPv4
PM1
PM2
Show qos policy-map-output
Show qos policy-map-output policy-map-name qos-policy-output
Show qos qos-policy-input
Show qos qos-policy-output
Show qos qos-policy-input qos-policy-name
Qos-policy Enter the QoS policy name Name None
Show qos statistics
Dell#show qos qos-policy-output
Syntaxshow qos statistics wred-profile interface interface
Wred-profile
Show qos wred-profile
Show qos wred-profile wred-profile-name
Enter a weight for the queue on the shared buffer as a
Service-class buffer shared-threshold-weight
Number in the range of 1 to
Parameters Enter the policy map name
Stack Optional Enter the keyword stack-unit then the stack
Unitnumber
Unit slot number
Portpipe
Following describes the test cam-usage service-policy input
Field Description Stack-unit
Threshold
Field Description Estimated CAM
Status Allowed
L2ACL
Min number
Related Wred-profile creates a Wred profile Commands
Trust
Diffserv
Dot1p
Wred yellow green profile-name
Wred
Parameters Yellow green
Wred ecn
Wred ecn
No wred weight number
Wred weight
Parameters Weight
Wred-profile
Ftos conf-qos-policy-out # wred weight
Wred-profile
Pps
Packets
Peak-rate
Service-pool wred
Dscp Color Map Commands
String
Dscp yellow red list-dscp-values
Dscp
Red
Qos dscp-color-map
Dellconf-dscp-color-map# dscp yellow 9,10,11,13,15,16
Qos dscp-color-map map-name
Dellconf#qos dscp-color-map mymap
Qos dscp-color-policy
Dscp-color-policycolor-map-profile-name
Show qos dscp-color-policy
Show qos dscp-color-policy summary interface detail
Show qos dscp-color-map
Map-name Enter the name of the color map
Auto-summary
Routing Information Protocol RIP
Auto-summary
Debug ip rip
Clear ip rip
Clear ip rip
Trigger
Default-metric
Enter a description of the RIP routing protocol
Syntaxdistance weight ip-address mask prefix-name
Prefix-name Optional Enter a configured prefix list name
Configure a filter for outgoing routing updates
Optional Enter the keyword connected to filter only
Ip poison-reverse
Ip rip receive version
Ip poison-reverse
Ip rip receive version 1
Ip rip send version
Ip rip send version 1
Ip split-horizon
Ip split-horizon
Ip poison-reverse sets the prefix for RIP routing updates
Neighbor
Network
Offset-list
Offset
Output-delay
Output-delay delay
This command is intended for low-speed interfaces
Redistribute connected static
Redistribute isis
Route-map map-name command
Redistribute ospf process-id match external 1 2 match
Internal metric metric-value route-map map-name
External 1 2 match internal metric metric-value
Router rip
Router rip
Dellconf#router rip Dellconf-routerrip#
Show ip rip database
Dellconf-routerrip#show config
Show ip rip database ip-address mask
Show running-config rip
Show running-config rip
Update
Timers basic
Invalid
Holddown
Flush
Version
Version 1
Rmon alarm
Remote Monitoring Rmon
Number Variable Interval
Defaults Command Modes Command History Owner string
Delta Absolute
Rmon collection history
ControlEntry
Owner name
Buckets
Rmon collection statistics
Rmon event number log trap community description string
Rmon event
Trap
Rmon hc-alarm
Rmon hc-alarm number variable interval delta absolute
Rising-threshold value event-number falling-threshold value
Delta
Defaults Command Modes Command History Rising
Threshold value
Event-number
Falling
Show rmon alarms
Show rmon alarms index brief
Show rmon
Show rmon
Index
Show rmon events
Show rmon events index brief
Example Index Example Brief Version Description 1.0
Show rmon hc-alarm index brief
Show rmon hc-alarm
Example Index VersionDescription 70.0
Dell#show rmon hc-alarm brief
Show rmon history
Snmp OID
6.1.2.1.1.3
Example Index Example Brief VersionDescription
Show rmon log
Show rmon log index brief
Usage Information Example Index Example Brief
Show rmon statistics
Show rmon statistics index brief
Command Modes Command History Example Index
Bytes packets overflow
Dell#show rmon statistics br
Rapid Spanning Tree Protocol Rstp
Bridge-priority
Bridge-priority priority-value
Priority-value
Debug spanning-tree rstp
Parameters Command Modes All
Bpdu interface in out
Enter a description of the rapid spanning tree
Disable Rstp globally on the system
Hello-time milli-second seconds
Milli-second
Protocol spanning-tree rstp
Protocol spanning-tree rstp
Disable disables Rstp globally on the system
Dellconf-rstp#show config
No disable
Show spanning-tree rstp
Bridge-priority
Down EDS Shut
Te 4/1 Desg 128.419 128 20000 FWD
Te 4/8 Root 128.426 128 20000 FWD
Te 4/9 Altr 128.427 128 20000 BLK
Spanning-tree rstp
BLK
Defaults Command Modes Command History Loopguard
Edge-port Bpduguard Shutdown-on- violation Priority priority
Introduced the hardware shutdown-on-violation options
Configuration conf-rstp
Security
AAA Accounting Commands
Aaa accounting
Role-name
Aaa accounting suppress
Aaa accounting Suppress Null-username command
Aaa accounting Suppress Null-username
Accounting exec commands level role role-name method
Accounting exec or aaa accounting commands
Accounting
Exec
Aaa radius group
Aaa radius group group-name
Show accounting
Show accounting
Authorization
Authorization and Privilege Commands
Authorization exec commands level role role-name
Parameters Defaults Command Modes Command History Commands
Aaa authorization commands
Role role-name
Aaa authorization config-commands
Aaa authorization config-commands
Aaa authorization config-commands command
Aaa authorization exec
Privilege level Configuration mode
Syntaxprivilege mode level level command reset command
Reset
Mode
Privilege level Line mode
Privilege level level
Obscure Password Commands
Service obscure-passwords
Service obscure-passwords
Passwords command
Authentication and Password Commands
Aaa authentication enable
Parameters Default
Method
Aaa authentication login
Method4
Access-class access-list-name
Enable password
Name Not configured
Syntaxenable password level level encryption-type password
Parameters Level level
Level and use the privilege level Configuration mode command
Enable restricted encryption-type password
Enable restricted
Encryption- type Password
Enable secret
Syntaxenable secret level level encryption-typepassword
Syntaxlogin authentication method-list-name default
Login authentication
Login authentication command
Password
Password-attributes
Max-retry
Lockout-period
Character
Restriction
Service password-encryption
Service password-encryption
Commands Command modes
Show privilege
Dell#show privilege
Current privilege level is
Using
Show users
Show users all
Field Description Untitled
Timeout login response
Timeout login response seconds
Access-class
Nopassword
Username
Secret
Privilege level
Radius Commands
Debug radius
Ip radius source-interface
Debug radius
Radius-server deadtime
Deadtime command
Radius-server deadtime seconds
Radius-server group
Hostname Ipv4-address ipv6-address
Radius-server host
Encryption- type key
Radius Server Group Configuration
Dellconf-radius-group#no radius-server host
Radius-server vrf
Syntaxradius-server vrf vrf-name source-interface interface
Radius-server key
Radius-server key encryption-type key
For the key entered. The options are
Radius-server timeout
Radius-server timeout seconds
Radius-server retransmit
Radius-server retransmit retries
Tacacs-server group
TACACS+ Commands
Aaa tacacsgroup group-name
Debug tacacs+
Debug tacacs+
Ip tacacs source-interface
Ip tacacs source-interface interface
Tacacs-server group group-name
Port number timeout seconds key key
Timeout
Defaults Command Modes Key key
Tacacs-server host
Tacacs-server key
Tacacs-server key encryption-type key
Tacacs-server vrf
Syntaxtacacs-server vrf vrf-namesource-interface interface
Port Authentication 802.1X Commands
Tacacs Server Group
Dot1x authentication Configuration
Dot1x authentication Interface
Dot1x auth-fail-vlan
Dot1x auth-server
Dot1x guest-vlan
Dot1x mac-auth-bypass
Reauthentication
No dot1x mac-auth-bypass
Dot1x max-eap-req
Dot1x port-control
Dot1x quiet-period
Dot1x reauthentication
Dot1x server-timeout
Dot1x reauth-max
Dot1x supplicant-timeout
Dot1x tx-period
Auth-Fail Vlan Disable Auth-Fail Vlan id
Show dot1x interface
Show dot1x interface interface
Unauthorized
Forceauthorized
SSH Server and SCP Commands
Auth PAE State Initialize Backend State Dell#
Crypto key generate
Crypto key generate rsa rsa1
Rsa
Rsa1
Crypto key zeroize rsa
Crypto key zeroize rsa
Debug ip ssh
Ip scp topdir
Debug ip ssh client server
Ip scp topdir directory
Ip ssh authentication-retries
Ip ssh authentication-retries
Ip ssh connection-rate-limit
Ip ssh connection-rate-limit
Ip ssh hostbased-authentication
Ip ssh hostbased-authentication enable
Ip ssh password-authentication
Parameters Enable
Ip ssh key-size
512-869
Ip ssh rekey
Ip ssh rekey time rekey-interval volume rekey-limit
Time minutes
Ip ssh pub-key-file
Ip ssh pub-key-file Word
Ip ssh rhostsfile
Ip ssh rsa-authentication Config
Ip ssh rsa-authentication enable
Ciphers cipher
Ip ssh server
List
Hmac-sha1 Hmac-sha1-96 Hmac-sha2-256 Hmac-sha2-256-96
Introduced the cipher, kex and mac options on the Z9000
Dellconf# ip ssh server enable
Ip ssh server vrf
Dell# conf
Dellconf# ip ssh server port
Ip ssh source-interface
Dellconf#ip ssh server vrf vrf1
Dellconf#no ip ssh server vrf
Dellconf#ip ssh server vrf management
Dellconf#do ssh 10.10.10.2 -l admin
Ip ssh vrf
Dellconf#ip ssh source-interface tengigabitethernet 1/42
Dellconf#no ip ssh source-interface
Show crypto key mypubkey rsa rsa1
Show crypto
Mypubkey
Show ip ssh
RSA
Show ip ssh client-pub-keys
Hmac
Show ip ssh rsa-authentication
Show ip ssh rsa-authentication my-authorized-keys
Nux-1.force10networks.com
EFPaHiygd8U/FXict61jWs84Co1UTsAgRzDJ9aUSS75TVac=
Ipv4 address
Ssh
Cipher
MHMAC
Pport
Secure Dhcp Commands
Clear ip dhcp snooping binding
Ip dhcp relay information-option trust-downstream vrf
1446
Defaults Command Modes Interface type
Slot/port lease time
1448
No ip dhcp source-address-validation
Ip dhcp snooping vlan
No ip dhcp snooping vlan name
Show ip dhcp snooping binding
Role-Based Access Control Commands
Aaa authorization role-only
Inherit existing
Version Description 70.0
Role mode addrole deleterole role-name reset command
Role
Addrole
Deleterole
Mode mode
Show role mode mode command
Show role
Dell#show role mode configure management crypto-policy
Role access secadmin, sysadmin
Show userroles
Userrole
1455
Service Provider Bridging
Debug protocol-tunnel
Out both
Protocol-tunnel
Protocol-tunnel rate-limit rate stp
Protocol-tunnel destination-mac
Rate-limit rate
Stp
Protocol-tunnel destination-mac xstp address
Protocol-tunnel enable
Protocol-tunnel enable
Protocol-tunnel rate-limit
Protocol-tunnel rate-limit rate
Show protocol-tunnel
Show protocol-tunnel vlan vlan-id
Protocols Interface 1000
STP,PVST
LLDP,GVRP
MMRP,MVRP
LACP,DOT1X
OAM,PAUSE
SFlow
Defaults Command Modes Agent-addr ip- address ipv6- address
Sflow collector
Format for IPv4 or xxxxx format for IPv6
Fields of zeros
1465
Sflow enable Global
Sflow ingress-enable
Sflow enable
Sflow ingress-enable
Sflow extended-switch enable
Sflow extended-switch enable
Sflow max-header-size extended
Sflow max-header-size extended
Extended
Dellconf#sflow max-header-size extended
Sflow polling-interval Global
Sflow polling-interval interval value
Sflow polling-interval Interface
Sflow sample-rate Global
Sflow sample-rate value
Sflow sample-rate Interface
Show sflow
Display the current sFlow configuration Syntax
Show sflow interface
1474
Snmp Commands
Simple Network Management Protocol Snmp and Syslog
Show snmp
Show snmp
Show snmp engineID
Show snmp group
Show snmp engineID
Show snmp group
Show snmp user
Show snmp user
Snmp ifmib ifalias long
Series legacy command Example
Snmp ifmib ifalias long
Snmp-server community
Ipv6 access
Security-name
1481
Snmp-server contact
Snmp-server enable traps
VersionDescription Series legacy command
Notification
Option
Snmp-server engineID
Linkdown Linkup
Remote ip- address
Local engineID
Udp-port port- number engineID
Snmp-server group
Groupname
Name ipv6 Access-list
Snmp-server host
Traps
Informs
Version 1 2c
Udp-port port
Added support for config and ecmp traps
Snmp-server location
Snmp-server location text
Snmp-server packetsize byte-count
Snmp-server packetsize
Byte-count
Snmp-server trap-source
Snmp-server trap-source interface
Snmp-server user
Remote ip
Auth-password
Priv password
Encrypted
Md5 sha
Optional Enter the keyword ipv6 then the IPv6 access list
Optional Enter both an IPv4 and IPv6 access list name
Up to 16 characters long
Name a string up to 16 characters long
Snmp-server user for AES128-CFB Encryption
Aes128
Snmp-server view
Syntaxsnmp-server view view-nameoid-treeincluded excluded
View-name
Oid-tree
Snmp-server vrf
Excluded
Snmp-server vrf vrf-name
Associate an Snmp agent with that VRF
Snmp trap link-status
Snmp trap link-status
Clear logging
Syslog Commands
Clear logging
Commands Buffer
Default logging buffered
Clear logging auditlog
Default logging console
Default logging monitor
Default logging console
Series legacy command Related
Default logging trap
Default logging trap
Logging
Logging buffered
Critical , errors , warnings , notifications
Logging buffered level size
Logging console
Logging console level
Errors , warnings , notifications , informational , or
Logging facility
Logging extended
Facility-type
1510 Simple Network Management Protocol Snmp and Syslog
Commands Logging on enables logging
Logging history
Logging history level
Indicate a value from 0 to 7 or enter one of the following
Logging history size size
Logging history size
Indicate a value as the number of messages to be stored
Logging monitor
Parameters emergencies, alerts, critical, errors
Logging monitor level
Logging on
Logging on
Logging source-interface
Source-interface command
Logging source-interface interface
Logging synchronous
Syntaxlogging synchronous level level all limit number-of
Limit number
Of-buffers
Logging trap
Parameters emergencies , alerts , critical , errors
Logging trap level
Logging version
Logging version
Show logging
Show logging auditlog
Dellconf#logging version
Command Modes Command History Example Partial Reverse
Show logging driverlog stack-unit
Example History
Show logging driverlog stack-unit unit#
Unit#
Terminal monitor
Terminal monitor
1523
Snmp Traps
RPM0-PCP %SNMP-4-RMONRISINGTHRESHOLD Rmon
RPM0-PCP %SNMP-4-RMONHCRISINGTHRESHOLD Rmon
RPM0-PCP %SNMP-4-RMONFALLINGTHRESHOLD Rmon
RPM0-PCP %SNMP-4-RMONHCFALLINGTHRESHOLD Rmon
SFM
CHMGR-1-MINORPS Minor alarm power supply non Redundant
CHMGR-2-MINORTEMP Minor alarm chassis Temperature
TME-2-TASK Suspended Suspended svce%d inst Task%s
TME-2-ABNORMALTASKTERMINATION Crash task%s
Vrrpprotoerr Vrrp protocol error on %S
VRRP-6-VRRPMASTER vrid-%d on %s entering Master
TRAP-5-PEERESTABLISHED Neighbor %a, state %s
TRAP-5-BACKWARDSTATETRANS Neighbor %a, state %s
Syntaxredundancy disable-auto-reboot stack-unit members
Redundancy disable-auto-reboot
Stacking
VersionDescription 70.0 Introduced on the S6000
Redundancy force-failover stack-unit
Redundancy force-failover stack-unit
Redundancy protocol
Reset stack-unit
Hard
Show redundancy
Show redundancy
Span
No block sync done Dell#
Show system stack-ports
Stack-unit priority
Example Status Example Topology Related Commands
Stack-number
S4810S4820T
Stack-unit provision
S6000Z9000
Syntaxstack-unit unit-idstack-group stack-group-id
Stack-unit stack-group
Unit-id Enter the stack unit ID
Upgrade boot system stack-unit all stack-unit-number a B
Upgrade system stack-unit
Boot
1540 Stacking
Storm Control
Show storm-control broadcast
Show storm-control multicast
Show storm-control broadcast interface
Show storm-control multicast interface
Show storm-control unknown-unicast
Show storm-control unknown-unicast interface
Storm-control broadcast Configuration
Syntaxstorm-control broadcast packetspersecond
Percentagedeci
Malvalue
Packetsperse
Cond
Storm-control multicast Configuration
Control multicast packetspersecond in command
Storm-control broadcast Interface
Storm-control multicast packetspersecond
Storm-control multicast Interface
Storm-control unknown-unicast Configuration
Syntaxstorm-control unknown-unicast packetspersecond
Storm-control unknown-unicast Interface
Wred-profile name
1550 Storm Control
Spanning Tree Protocol STP
Syntaxbridge-priority priority-value primary secondary
Bpdu-destination-mac-address
Debug spanning-tree
Address as the destination MAC address in its BPDUs
Gvrp
Stp-id
Pvst, or rstp
General
Root
Disable
Spanning Tree
Enter the number of seconds the Dell Networking OS waits
To return to the default value, use the no hello-timecommand
1557
Protocol spanning-tree
Protocol spanning-tree stp-id
Show spanning-tree
Enter 0 zero to display information about that specific
Timers
Field Description Bridge
Identifier
We are
Example Brief Usage Information
32768 0001.e800.0a56 Te 1/2
32768 0001.e800.0a56 Te 1/3
32768 0001.e800.0a56 Dell#
LIS
Example Guard Field Description Instance
EDS
Portfast bpduguard shutdown-on- viol ation Priority priority
1565
System Time and Date
Clock summer-time date
Clock summer-time recurring
End-month
End-time
End-year
Start-week
End-week
Timezone
Clock timezone
Name Offset
Authentication
Adjust
Debug ntp
Ntp authenticate
Ntp authenticate
Ntp broadcast client
Ntp broadcast client
Ntp disable
Ntp disable
Ntp multicast client
Ntp multicast client multicast-address
Ntp master stratum
Ntp master stratum
Parameters Ntp
Masterstratum
Ntp server
Address key keyid prefer version number
Key keyid
Prefer
Ntp source
Ntp source interface
Ntp trusted-key
Ntp trusted-key number
Ntp authentication-key number md5 0 7 key
Ntp authentication-key
Md5
Show clock detail
Show clock
Parameters Detail
Show ntp associations
Show ntp associations
Delay
Field Description None
Remote
Ref clock
Show ntp vrf associations
Show ntp status
Master synced, # master unsynced, + selected, candidate
Show ntp status
1583
Commands Configurations
Tunneling
Tunnel-mode
Number anylocal
Tunnel source
Ip-address Ipv6-address Interface-type- number Anylocal
Ip-address ipv6
Tunnel keepalive
Unlimited
Tunnel allow-remote
Tunnel dscp mapped value
Tunnel dscp
Mapped
Tunnel flow-label
Tunnel hop-limit
Tunnel flow-label value
Tunnel hop-limit value
Tunnel destination
Tunnel destination ip-address ipv6-address
Interface-type interface- number
Ip unnumbered
Version 70.0 30.1 40.1
Ipv6 unnumbered
Version 70.0 30.1 40.0
1594 Tunneling
Vlan Stacking
Dei enable
Dei enable
Dei honor
Dei honor 0 1 green red yellow
Dei mark
Dei mark green yellow 0
Member
No stack-unit unit-idstack-group stack-group-id
Unit-id
Stack-group-id
Use no stack-unit unit-id stack-group stack-id
Vlan-stack access
Vlan-stack access
Compatible command
Dell#show vlan Codes * Default VLAN, G Gvrp VLANs
Vlan-stack compatible
Vlan-stack compatible
Vlan-stack dot1p-mapping
Vlan-stack protocol-type
Tag-dot1p
Sp-tag-dot1p
Enter the hexadecimal number as the stackable Vlan tag
Vlan-stack trunk
Stack trunk command
Vlan-stack trunk
1605
1606
Virtual Routing and Forwarding VRF
No ipv6 unknown-unicast
Ipv6 unknown-unicast
Description string
Ip vrf forwarding vrf-name management
Ip vrf forwarding
Vrf-name
Syntax Parameters Defaults Command Modes
Ip route-export
Example
Route-export
Ip route-import tag route-map-name
Ip route-import
Parameters Route-import
Ipv6 route-export tag route-map-name
Ipv6 route-export
Parameters Route-export
Ipv6 route-import
Ipv6 route-import tag route-map-name
Match source-protocol
Syntaxmatch source-protocol bgp isis ospf connected static
Redistribute imported-bgp import-ospf import-isis
Imported-bgp
Imported-ospf
Imported-isis
Command History Related Commands Version Description 70.0
Interface management
Maximum dynamic-routes
Interface management
Show ip vrf
Show ip vrf vrf-name
Show run vrf
Show run vrf vrf-name
1619
VLT Proxy Gateway
Proxy-gateway lldp
No proxy-gateway lldp
Dellconf#vlt-domain Dellconf-vlt-domain#proxy-gateway lldp
Remote-mac-address exclude-vlan
Proxy-gateway static
Remote-mac
Peer-domain-link port-channel exclude-vlan
Parameters Port-channel
No peer-timeout value
Proxy-gateway peer-timeout
Dellconf-vlt-domain-proxy-gw-lldp# peer-timeout
Show vlt-proxy-gateway
Vlt-peer-mac transmit
Lldp
Dell#show vlt proxy-gateway VLT Proxy Gateway Brief
Virtual Link Trunking VLT
Back-up destination
Back-up destination ipv4-address ipv6 ipv6-address
Interval seconds
Clear vlt statistics
Delay-restore
Command History Example Related Commands
Delay-restore
Parameters Delay-restore
Lacp ungroup member-independent
Lacp ungroup member-independent vlt port-channel
Multicast peer-routing timeout value
Multicast peer-routing timeout
Usage Information Example Version Description 70.0
Peer-down
Peer-link port-channel
Vlan vlan id
Peer-routing
Peer-routing
Peer-routing-timeout
Peer-routing-timeout value
Primary-priority
No primary-priority
Show vlt brief
Show vlt brief
Show vlt backup-link
Show vlt backup-link
Show vlt counters
DellVLTpeer1# show vlt backup-link
Show vlt counters arp igmp-snoop interface mac ndp
ARP
Show vlt detail
Show vlt inconsistency
Show vlt detail
Show vlt inconsistency ip mroute
Command Exec Modes Command History
Show vlt mismatch
225.1.1.2
Show vlt mismatch
Example for Q- in-Q implementatio n over VLT
128 4094 100 Dell#
Show vlt private-vlan
Show vlt role
Show vlt private-vlan
Show vlt role
Show vlt statistics
Show vlt statistics arp domain igmp-snoop mac
Command Modes Command History Related Commands Example
Show vlt statistics igmp-snoop
Show vlt statistics igmp-snoop
DellVLTpeer1#show vlt statistics igmp-snoop
Unit-id
Unit-id 0
Vlt domain domain-id
Vlt domain
Domain-id
Vlt-peer-lag port-channel id-number
Vlt-peer-lag port-channel
Id-number
Feature vxlan
Virtual Extensible LAN Vxlan
Debug vxlan
Version Description 70.0 Introduced on the S6000-ON Usage
Fail-mode
Vxlan-instance
Parameters Secure
Version Description 70.0 Introduced on the S6000-ON Related
Instance ID
Vxlan-instance VAP
Version Description 70.0 Introduced on the S6000-ON 40.0
Gateway-ip
Maxbackoff
Gateway-ip IP address
Controller
Controller ID
Ptcp
Pssl
Show vxlan vxlan-instance
Show vxlan vxlan-instance instance ID
Show vxlan vxlan-instance unicast-mac-remote
Show running-config vxlan
Vnid Vnid
Show vxlan vxlan-instance unicast-mac-local
Tunnel
VNI MAC
4656 000001000001 36.1.1.1
Show vxlan vxlan-instance statistics interface
Example Related Commands Version Description 0.0
Port Vlan VNI MAC
Show vxlan vxlan-instance physical-locator
Version Description 70.0 Introduced on the S6000-ON Example
Dell#show vxlan vxlan-instance 1 physical-locator
Tunnel count
Show vxlan vxlan-instance logical network
Show vxlan vxlan-instance instance ID logical-network name
Clear vxlan vxlan-instance statistics
Clear mac-address-table dynamic all
Clear vxlan vxlan-instance instance ID statistics
Clear mac-address-table dynamic all
IPv4 Vrrp Commands
Virtual Router Redundancy Protocol Vrrp
Advertise-interval
Centisecs
Syntaxauthentication-type simple encryption-type password
Authentication-type
Parameters Defaults Command Modes Command History Simple
Clear counters vrrp vrrp-id ipv6 vrf vrf-name
Clear counters vrrp
Vrrp-id
Bfd database interface ipv6 packets state timer
Debug vrrp
Command Modes Command History Usage Information Packets
Timer
Virtual-address command and enter no disable
Hold-time
Hold-time seconds centisecs centisecs
Preempt
Priority
Preempt
Priority priority
Show config verbose
Dellconf-if-vrid-4#show config
Show vrrp
Vrrp-group
Virtual-address
Grp
Master addr
Example Brief Usage Information Description Virtual addrs
Hold Down
Adv rcvd
Virtual MAC
Example Example Vrrp VRF Description Virtual IP address
Tracking states
Track interface priority-cost cost
Track
Priority-cost
Virtual-address
Ip-address1
Vrrp delay minimum seconds
Vrrp delay minimum
Enter the number of seconds for the delay for Vrrp
Vrrp delay reload
Vrrp delay reload seconds
Vrrp-group
Vrrp-group vrrp-id
Version
Version 2 3 both
IPv6 Vrrp Commands
Debug vrrp ipv6
Clear counters vrrp ipv6
Vrid
Enter the keyword bfd to enable debugging of all Vffp BFD
Show vrrp ipv6
Show vrrp ipv6 vrid interface brief vrf vrf-name
State master
Line Beginning Description With GigabitEthernet
Address Virtual IP address
Vrrp-ipv6-group
Vrrp group and is also used for VRF routing